Rapid Fire Session

Courtney J. Pfister, BSc
Student
Northwestern University
Chicago, Illinois, United States
Courtney J. Pfister, BSc
Student
Northwestern University
Chicago, Illinois, United States
Kai Lin, MD
Research Associate Professor
Northwestern University Feinberg School of Medicine, United States
Roberto Sarnari, MD
Clinical Research Associate
Northwestern University Feinberg School of Medicine
Chicago, Illinois, United States

Daniel C. Lee, MD
Professor of Medicine and Radiology
Northwestern University Feinberg School of Medicine
Chicago, Illinois, United States

James Carr, MD
Chair
Northwestern University Feinberg School of Medicine
chicago, Illinois, United States
Model | Outcome Type | Specific Outcomes Evaluated |
Logistic Regression | All-cause mortality | Alive status at 1-, 3-, and 5-years post-MRI |
Major Adverse Cardiac Events (MACE) | Occurrence at 1-, 3-, and 5- years post-MRI | |
Cardiovascular Events (CVEs) | Occurrence at 1-, 3-, and 5- years post-MRI | |
Cox Proportional Hazards (CPH) | Survival | For patients alive at follow-up, time from index MRI to chart review in the electronic medical record (Epic) |
Survival free of MACE | Binary: event vs. no event during follow-up | |
Survival free of CVEs | Binary: event vs. no event during follow-up |
Clinical outcomes assessed by logistic regression (events at 1, 3, and 5 years) and CPH models (time-to-event survival, MACE, and CVEs). MACE is a composite of cardiovascular death, myocardial infarction, hospitalization for heart failure, or revascularization. CVEs include any emergency department visit, hospitalization, or death that cannot clearly be attributed to non-cardiovascular causes (e.g. trauma, accidents). Table 2. Post-HTx clinical outcomes with follow-up, event rates, and significant CMR predictors.
HTx Outcome | Mean follow-up (months) | Logistic Regression Timepoint (n, %) | Significant CMR Predictors | ||
1-year | 3-year | 5-year | |||
All-cause mortality | 100 ± 103 | 6 (3.5%) | 9 (5.3%) | 18 (10.5%) | Logistic: T2 (1-year), LVM (3-year) CPH: Pre- and post-T1, T2 |
MACE | 81 ± 81 | 25 (14.6%) | 40 (23.4%) | 43 (25.1%) | NA |
CVE | 39 ± 39 | 50 (29.2%) | 101 (59.1%) | 121 (70.8%) | NA |
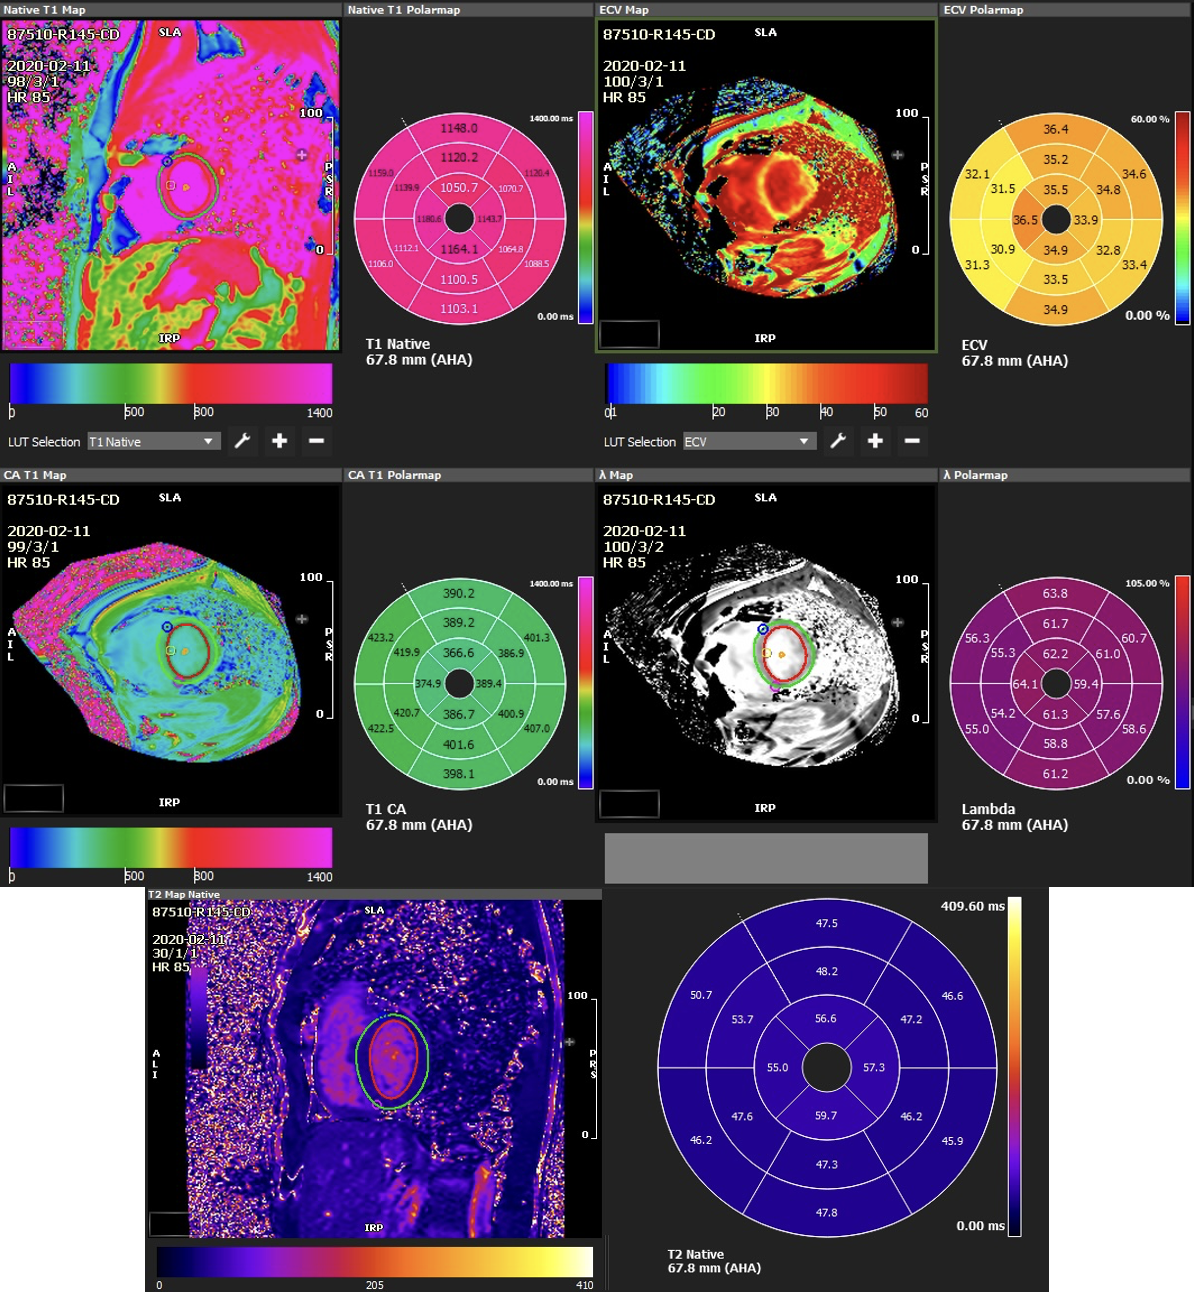
Mean follow-up time (± SD) is reported in months from index MRI to the outcome of interest (e.g., death) or, if no event occurred, to the time of chart review. Event counts (n) and percentages are shown for all-cause mortality, MACE, and CVEs at 1, 3, and 5 years. NA = no significant CMR-derived predictors. Significant CMR predictors included T2 for 1-year all-cause mortality, LVM for 3-year all-cause mortality, and pre-/post-contrast T1 and T2 on CPH analysis. Limited by the space and topic of this study, we are not listing non-MRI-derived cardiovascular indices that can be used to predict the outcomes.Figure 1. Multiparametric CMR maps at index scan. Example native and post-contrast T1, extracellular volume (ECV), and T2 maps from a representative subject at index CMR scan. Top Row: native T1 and ECV maps with corresponding polar plots. Middle Row: Post-contrast T1 map with polar plots. Bottom row: T2 map and polar plot.