Rapid Fire Session

John T. Echols, PhD
Post-doctoral Research Associate
University of Virginia
Charlottesville, Virginia, United States
Shuo Wang, MD, PhD
Research Associate
University of Virginia Health System
Charlottesville, Virginia, United States
Jamey Cutts, MD
Advanced Cardiac Imaging Fellow
University of Virginia Medical center
Charlottesville, Virginia, United States
Julia Bresticker, MS
MD/PhD Student
University of Virginia
Charlottesville, Virginia, United States

Jonathan A. Pan, MD, MSc, MBA
Assistant Professor
University of Virginia Health System
Charlottesville, Virginia, United States
Rohan Herur
MD Candidate
University of Virginia, United States
Aayush C. Amin
MRI technolgist
University of Virginia Health System, Virginia, United States
Matthew Wolf, MD, PhD
Associate Professor, Medicine: Cardiovascular Medicine
University of Virginia, United States
Peter Kellman, PhD
Dr.
National Institutes of Health, Maryland, United States

Christopher M. Kramer, MD
Professor
University of Virginia Health
Charlottesville, Virginia, United States

Frederick H. Epstein, PhD
Professor
University of Virginia
Charlottesville, Virginia, United States

Amit R. Patel, MD, FSCMR
Professor of Medicine
Division of Cardiology, University of Virginia Health System, Charlottesville, Virginia, USA.
Charlottesville, Virginia, United States
| Overall (n=29) | No hx of HFpEF (n=17) | Hx of HFpEF (n=12) | P value | |
Parameters | Mean ± SD or Median (interquartile range) or n (%) |
| |||
Age, yrs | 62 ± 12 | 59 ± 12 | 67 ± 11 | 0.077 | |
BMI, kg/m2 | 31 ± 7 | 29 ± 6 | 34 ± 8 | 0.080 | |
BSA, m2 | 1.9 ± 0.3 | 1.9 ± 0.3 | 1.9 ± 0.3 | 0.803 | |
Gender, female, n (%) | 20 (69%) | 10 (58%) | 10 (83%) | 0.234 | |
Ethnicity, n (%) |
|
|
| 0.345 | |
White | 27 (93%) | 16 (94%) | 11 (92%) |
| |
African American | 1 (3%) | 0 (0) | 1 (8%) |
| |
Others | 1 (3%) | 1 (6%) | 0 (0) |
| |
Comorbidities, n (%) |
|
|
|
| |
Prior smoker | 10 (35%) | 3 (17%) | 7 (58%) | 0.030 | |
Current smoker | 3 (10%) | 0 (0) | 3 (25%) | 0.060 | |
Obesity | 14 (48%) | 6 (35%) | 8 (67%) | 0.099 | |
CAD | 6 (21%) | 1 (6%) | 5 (42%) | 0.030 | |
CV family hx | 16 (55%) | 10 (59%) | 6 (50%) | 0.463 | |
Prior MI | 3 (10%) | 2 (12%) | 1 (8%) | 0.663 | |
Diabetes | 9 (31%) | 4 (24%) | 5 (42%) | 0.263 | |
Hypertension | 18 (62%) | 9 (53%) | 9 (75%) | 0.208 | |
Hyperlipidemia | 19 (66%) | 10 (59%) | 9 (75%) | 0.309 | |
OSA | 9 (31%) | 4 (24%) | 5 (42%) | 0.263 | |
Chronic renal disease | 5 (17%) | 0 (0) | 5 (42%) | 0.007 | |
Paroxysmal Atrial arrhythmia | 2 (7%) | 1 (6%) | 1 (8%) | 0.665 | |
Medication, n (%) |
|
|
|
| |
Diuretics, n (%) | 13 (45%) | 4 (24%) | 9 (75%) | 0.008 | |
MRA, n (%) | 4 (14%) | 1 (6%) | 3 (25%) | 0.178 | |
SLG2i, n (%) | 4 (14%) | 0 (0) | 4 (33%) | 0.021 | |
GLP-RA, n (%) | 5 (17%) | 1 (6%) | 4 (33%) | 0.078 | |
CMR parameters |
|
|
|
| |
LVEF, % | 61 ± 6 | 61 ± 6 | 62 ± 6 | 0.836 | |
LVEDVI, ml/m2 | 68 ± 16 | 69 ± 17 | 67 ± 16 | 0.732 | |
LVESVI, ml/m2 | 28 ± 9 | 28 ± 9 | 27 ± 9 | 0.853 | |
LVMI, g/m2 | 49 ± 11 | 46 ± 9 | 53 ± 13 | 0.118 | |
RVEF, % | 56 ± 7 | 56 ± 8 | 56 ± 7 | 0.853 | |
RVEDVI, ml/m2 | 71 ± 23 | 74 ± 27 | 67 ± 18 | 0.421 | |
RVESVI, ml/m2 | 31 ± 12 | 33 ± 14 | 29 ± 8 | 0.387 | |
LAVi, ml/m2 | 29 ± 12 | 28 ± 12 | 30 ± 12 | 0.694 | |
LGE, n (%) | 7 (22%) | 0 (12%) | 5 (42%) | 0.080 | |
Estimated LVFP (mmhg) | 12 ± 2 | 12 ± 2 | 13 ± 3 | 0.336 | |
Myocardial Native T1, ms | 1008 ± 38 | 996 ± 32 | 1027 ± 39 | 0.031 | |
ECV, % | 28 ± 3 | 26 ± 3 | 30 ± 3 | 0.002 | |
T2, ms | 49 ± 3 | 48 ± 2 | 50 ± 3 | 0.044 | |
EAT volume, ml | 89 ± 33 | 78 ± 22 | 104 ± 40 | 0.031 | |
EAT volume index, ml/m2 | 46 ± 13 | 41 ± 10 | 53 ± 15 | 0.134 | |
EAT Native T1 | N=22 | N=12 | N=10 |
| |
EAT Native T1, ms | 270 ± 18 | 273 ± 21 | 270 ± 15 | 0.405 | |
PAT Native T1, ms | 272 ± 31 | 273 ± 42 | 271 ± 25 | 0.756 | |
Quantitative Perfusion |
|
|
|
| |
Rest MBF, ml/min/g | 0.98 ± 0.31 | 0.87 ± 0.31 | 1.14 ± 0.23 | 0.028 | |
Stress MBF, ml/min/g | 2.12 ± 0.50 | 2.11 ± 0.54 | 2.13 ± 0.45 | 0.933 | |
MPR | 2.30 ± 0.71 | 2.58 ± 0.76 | 1.88 ± 0.32 | 0.011 | |
Circumferential systolic peak strain | -18 ± 2 | -19 ± 2 | -18 ± 3 | 0.196 | |
Longitudinal systolic peak strain | -17 ± 2 | -18 ± 2 | -16 ± 2 | 0.039 | |
SFA |
|
|
|
| |
SFA_EAT | 0.36 ± 0.04 | 0.34 ± 0.03 | 0.39 ± 0.04 | 0.011 | |
SFA_SAT | 0.34 ± 0.04 | 0.35 ± 0.05 | 0.33 ± 0.03 | 0.429 | |
SFA_VAT | 0.36 ± 0.03 | 0.36 ± 0.03 | 0.36 ± 0.04 | 0.946 | |
SFA index | 1.07 ± 0.20 | 1.00 ± 0.18 | 1.18 ± 0.18 | 0.042 | |
PUFA |
|
|
|
| |
PUFA_EAT | 0.16 ± 0.03 | 0.17 ± 0.03 | 0.15 ± 0.02 | 0.094 | |
PUFA_SAT | 0.14 ± 0.18 | 0.15 ± 0.18 | 0.14 ± 0.20 | 0.449 | |
PUFA_VAT | 0.18 ± 0.03 | 0.17 ± 0.02 | 0.18 ± 0.03 | 0.345 | |
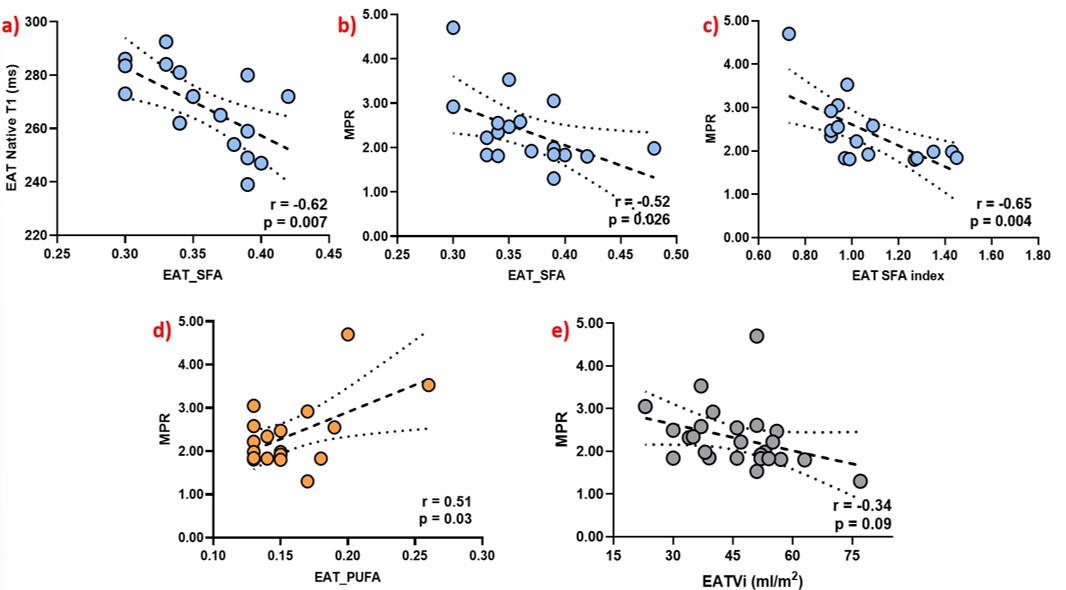
 Figure 2. Linear regression plots demonstrating associations between epicardial adipose tissue (EAT) fatty acid composition and cardiovascular magnetic resonance (CMR) parameters. Significantly good correlations observed between EAT SFA fraction and native EAT T1 (a), EAT SFA fraction and myocardial perfusion reserve (MPR) (b), EAT SFA index and MPR (c), and EAT PUFA fraction and MPR (d). No significant correlation was observed between EAT volume index (EATVi) and MPR (e).