Early Career Award Session
Virtual Recording

Xinheng Zhang, PhD
Post-doctoral Scientist
Cedars-Sinai Medical Center
Redwood City, California, United States
Xinheng Zhang, PhD
Post-doctoral Scientist
Cedars-Sinai Medical Center
Redwood City, California, United States

Li-Ting Huang, MD, MSc
radiologist
National Cheng Kung University Hospital
Los Angeles, California, United States
Archana V. Malagi, PhD
Postdoctoral Scientist
Cedars-Sinai Medical Center
Los Angeles, California, United States
Xinqi Li, MSc
Ph.D student
Cedars-Sinai Medical Center
Berlin, Berlin, Germany
Yuheng Huang
Ph. D. Candidate
UCLA, United States
Hao Ho, PhD
Assistant Professor
UCLA, United States
Alan C. Kwan, MD, MSc
Imaging cardiologist
Cedars-Sinai Medical Center, United States

Janet Wei, MD
Assistant Professor
Cedars Sinai Medical Center
Los Angeles, California, United States

Xiaoming Bi, PhD
Director, Cardiovascular MR Collaborations
Siemens Medical Solutions USA, Inc.
Oak Park, California, United States

Anthony G. Christodoulou
Associate Professor
University of California, Los Angeles (UCLA)
Los Angeles, California, United States

Debiao Li, PhD
Professor
Cedars Sinai Medical Center
Los Angeles, California, United States

Rohan Dharmakumar, PhD
Executive Director
Indiana University School of Medicine
Indianapolis, Indiana, United States
.jpeg "Hsin-Jung (Randy) Yang, PhD photo")
Hsin-Jung (Randy) Yang, PhD
Associate Professor
Biomedical Imaging Research Institute, Cedars-Sinai Medical Center, Los Angeles, CA, USA
Los Angeles, California, United States
 Figure 2. The dynamic curve, LRT-dDCE (PS, Fp, vp, and ve) maps and Gd concentration maps of the representative canine subject were successfully reconstructed. A) the dynamic curves obtained from the 2CXM can differentiate the MI, remote, and blood pool. B), the PS, Fp, Vp, and Ve maps from the LRT-dDCE images showed the corresponding changes related to MI region and MVO. Elevated Ve and PS were demonstrated in the hyperintense region on the LGE image. Fp and Vp were decreased in the hypointense cores on the EGE image. C) LRT-dDCE images showed consistent dynamic Gd concentration images (1-8 min) and simulated late Gd concentration maps can be further simulated (9-15 min).
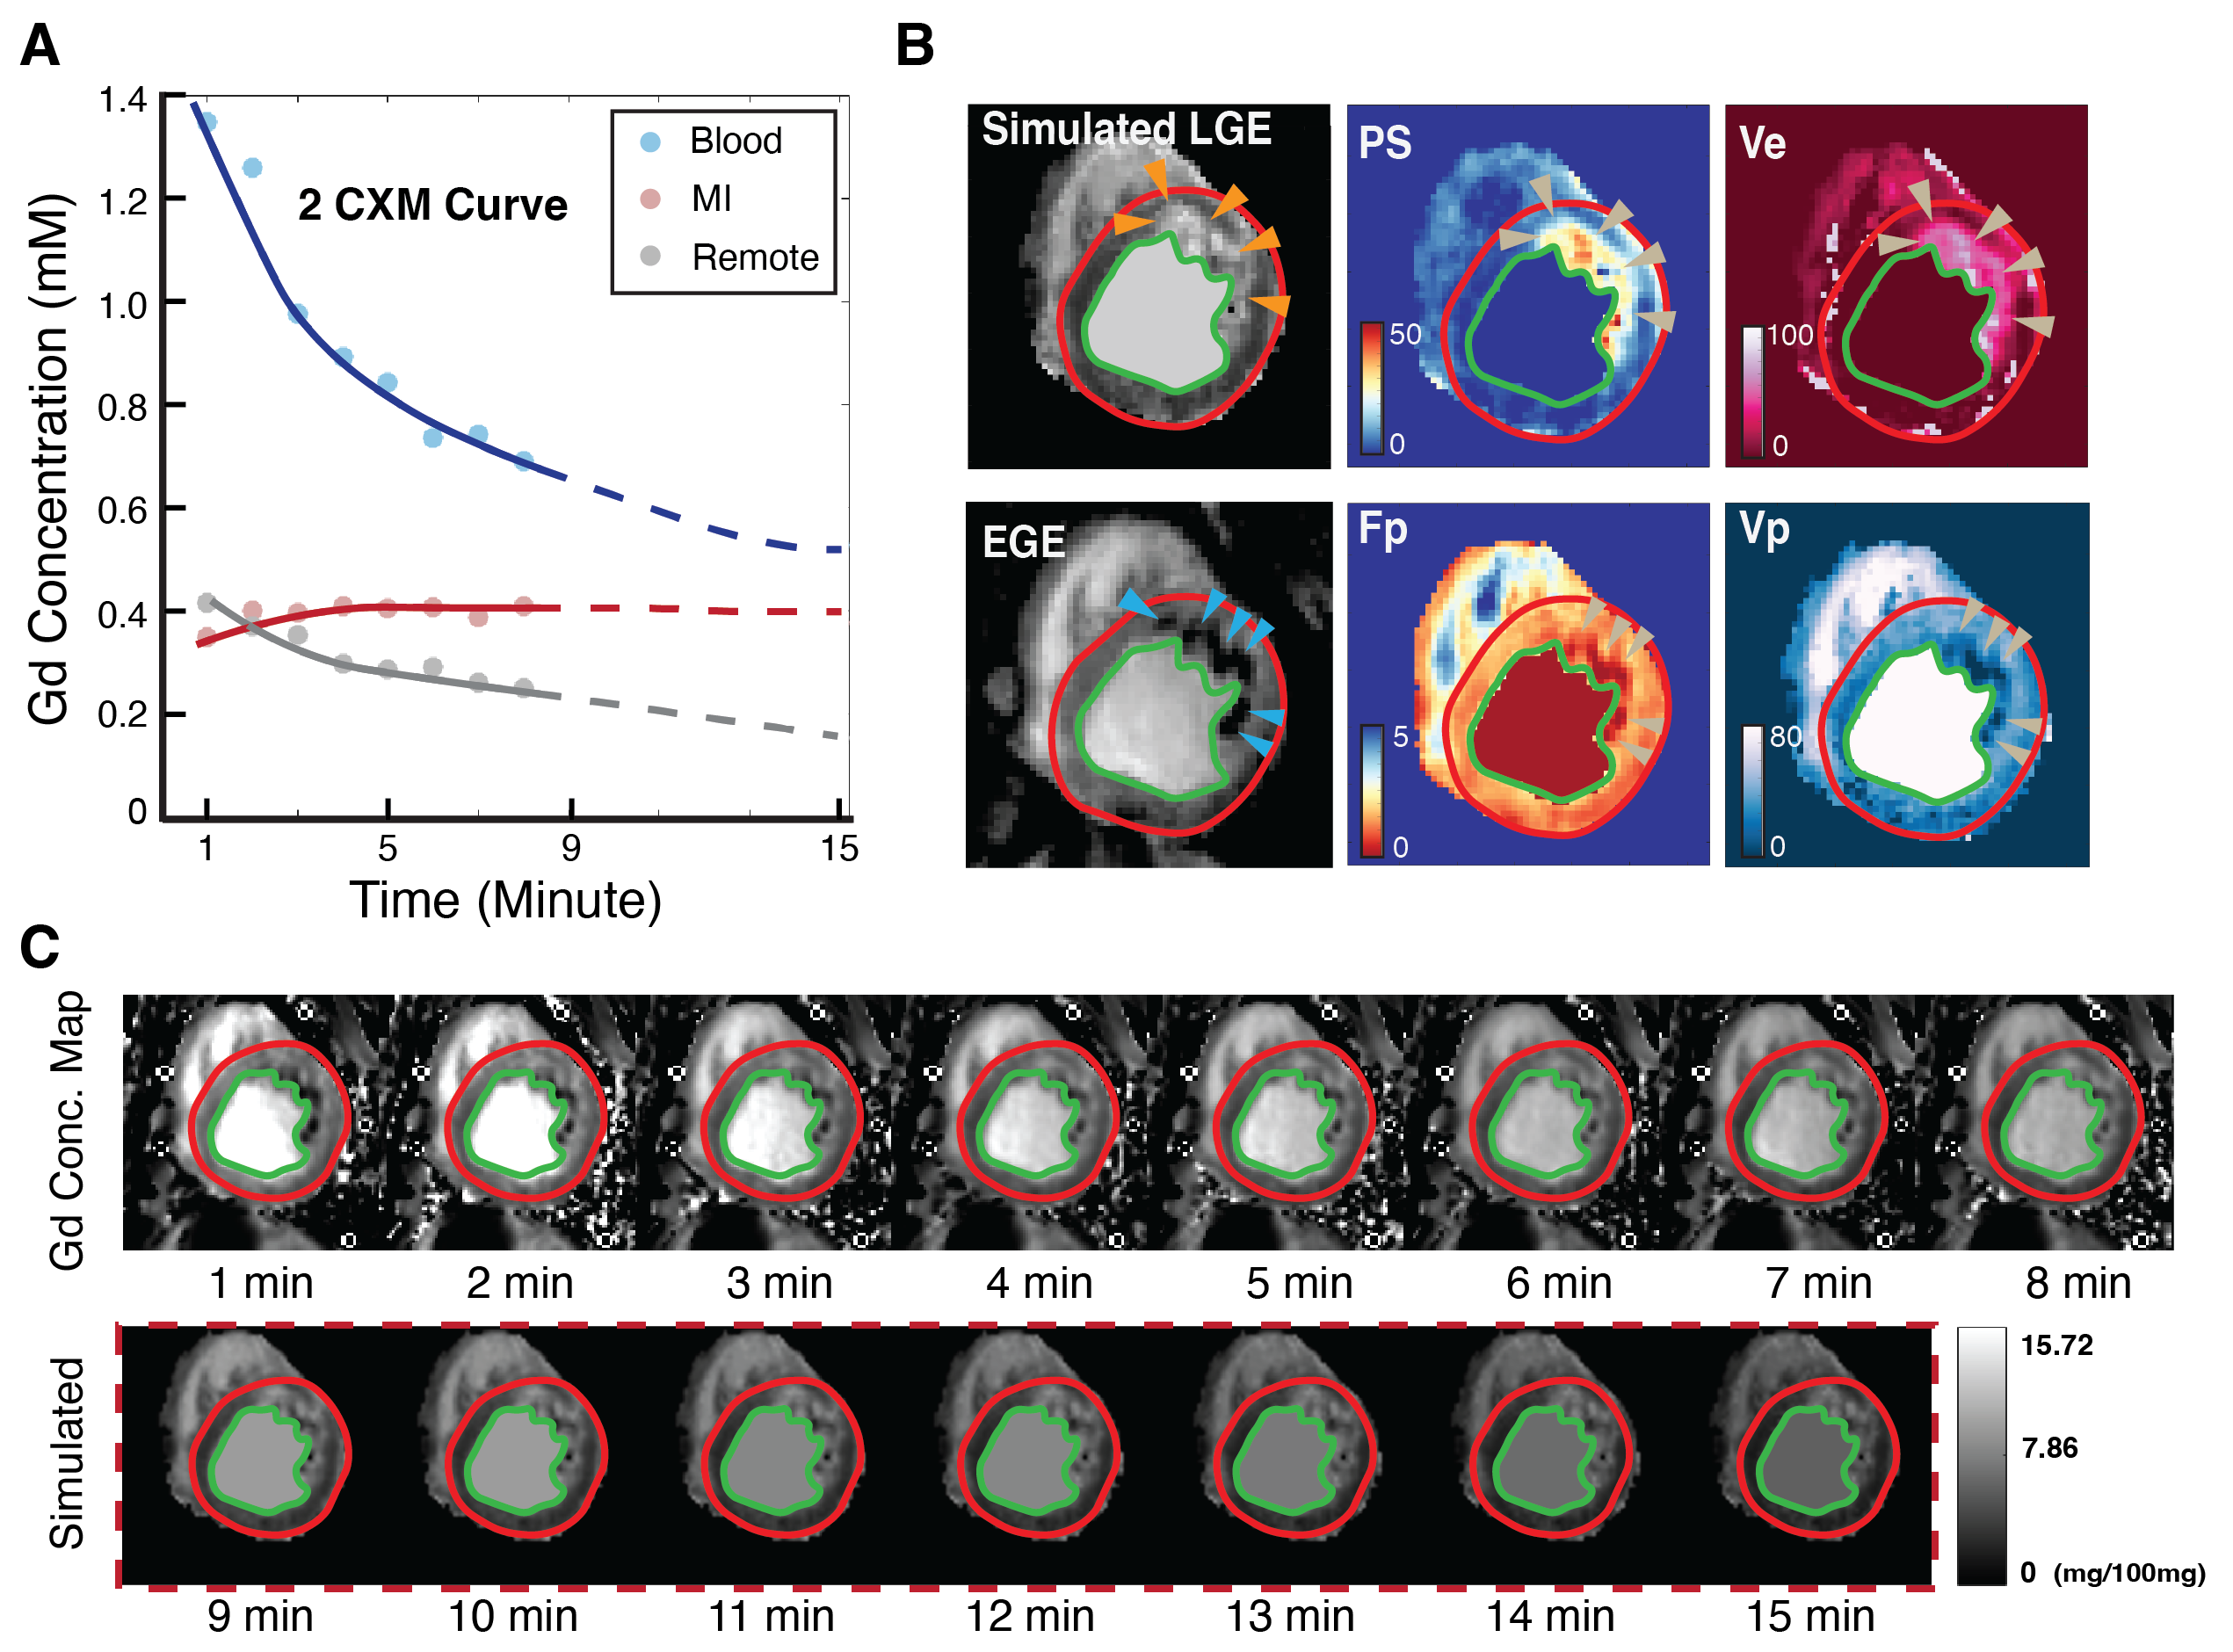 Figure 3. Visual and quantitative comparison of dDCE parameters from the proposed (8 min) and conventional 2D (30 mins) acquisitions in myocardial infarction (MI) and remote regions. A) LRT-dDCE and conventional 2D dDCE maps (PS, Ve) derived from gadolinium enhancement are compared to corresponding LGE and EGE images. Elevated PS and Ve correlate with MI (hyperintense on LGE, marked by arrowheads). Linear regression of B) LVEF and C) MI volume validates with conventional acquisitions. D) Ve and E) PS show significant differences between MI and remote regions, with no statistical difference between LRT-dDCE and MOLLI-dDCE within respective regions (**P < 0.01, ***P < 0.001).
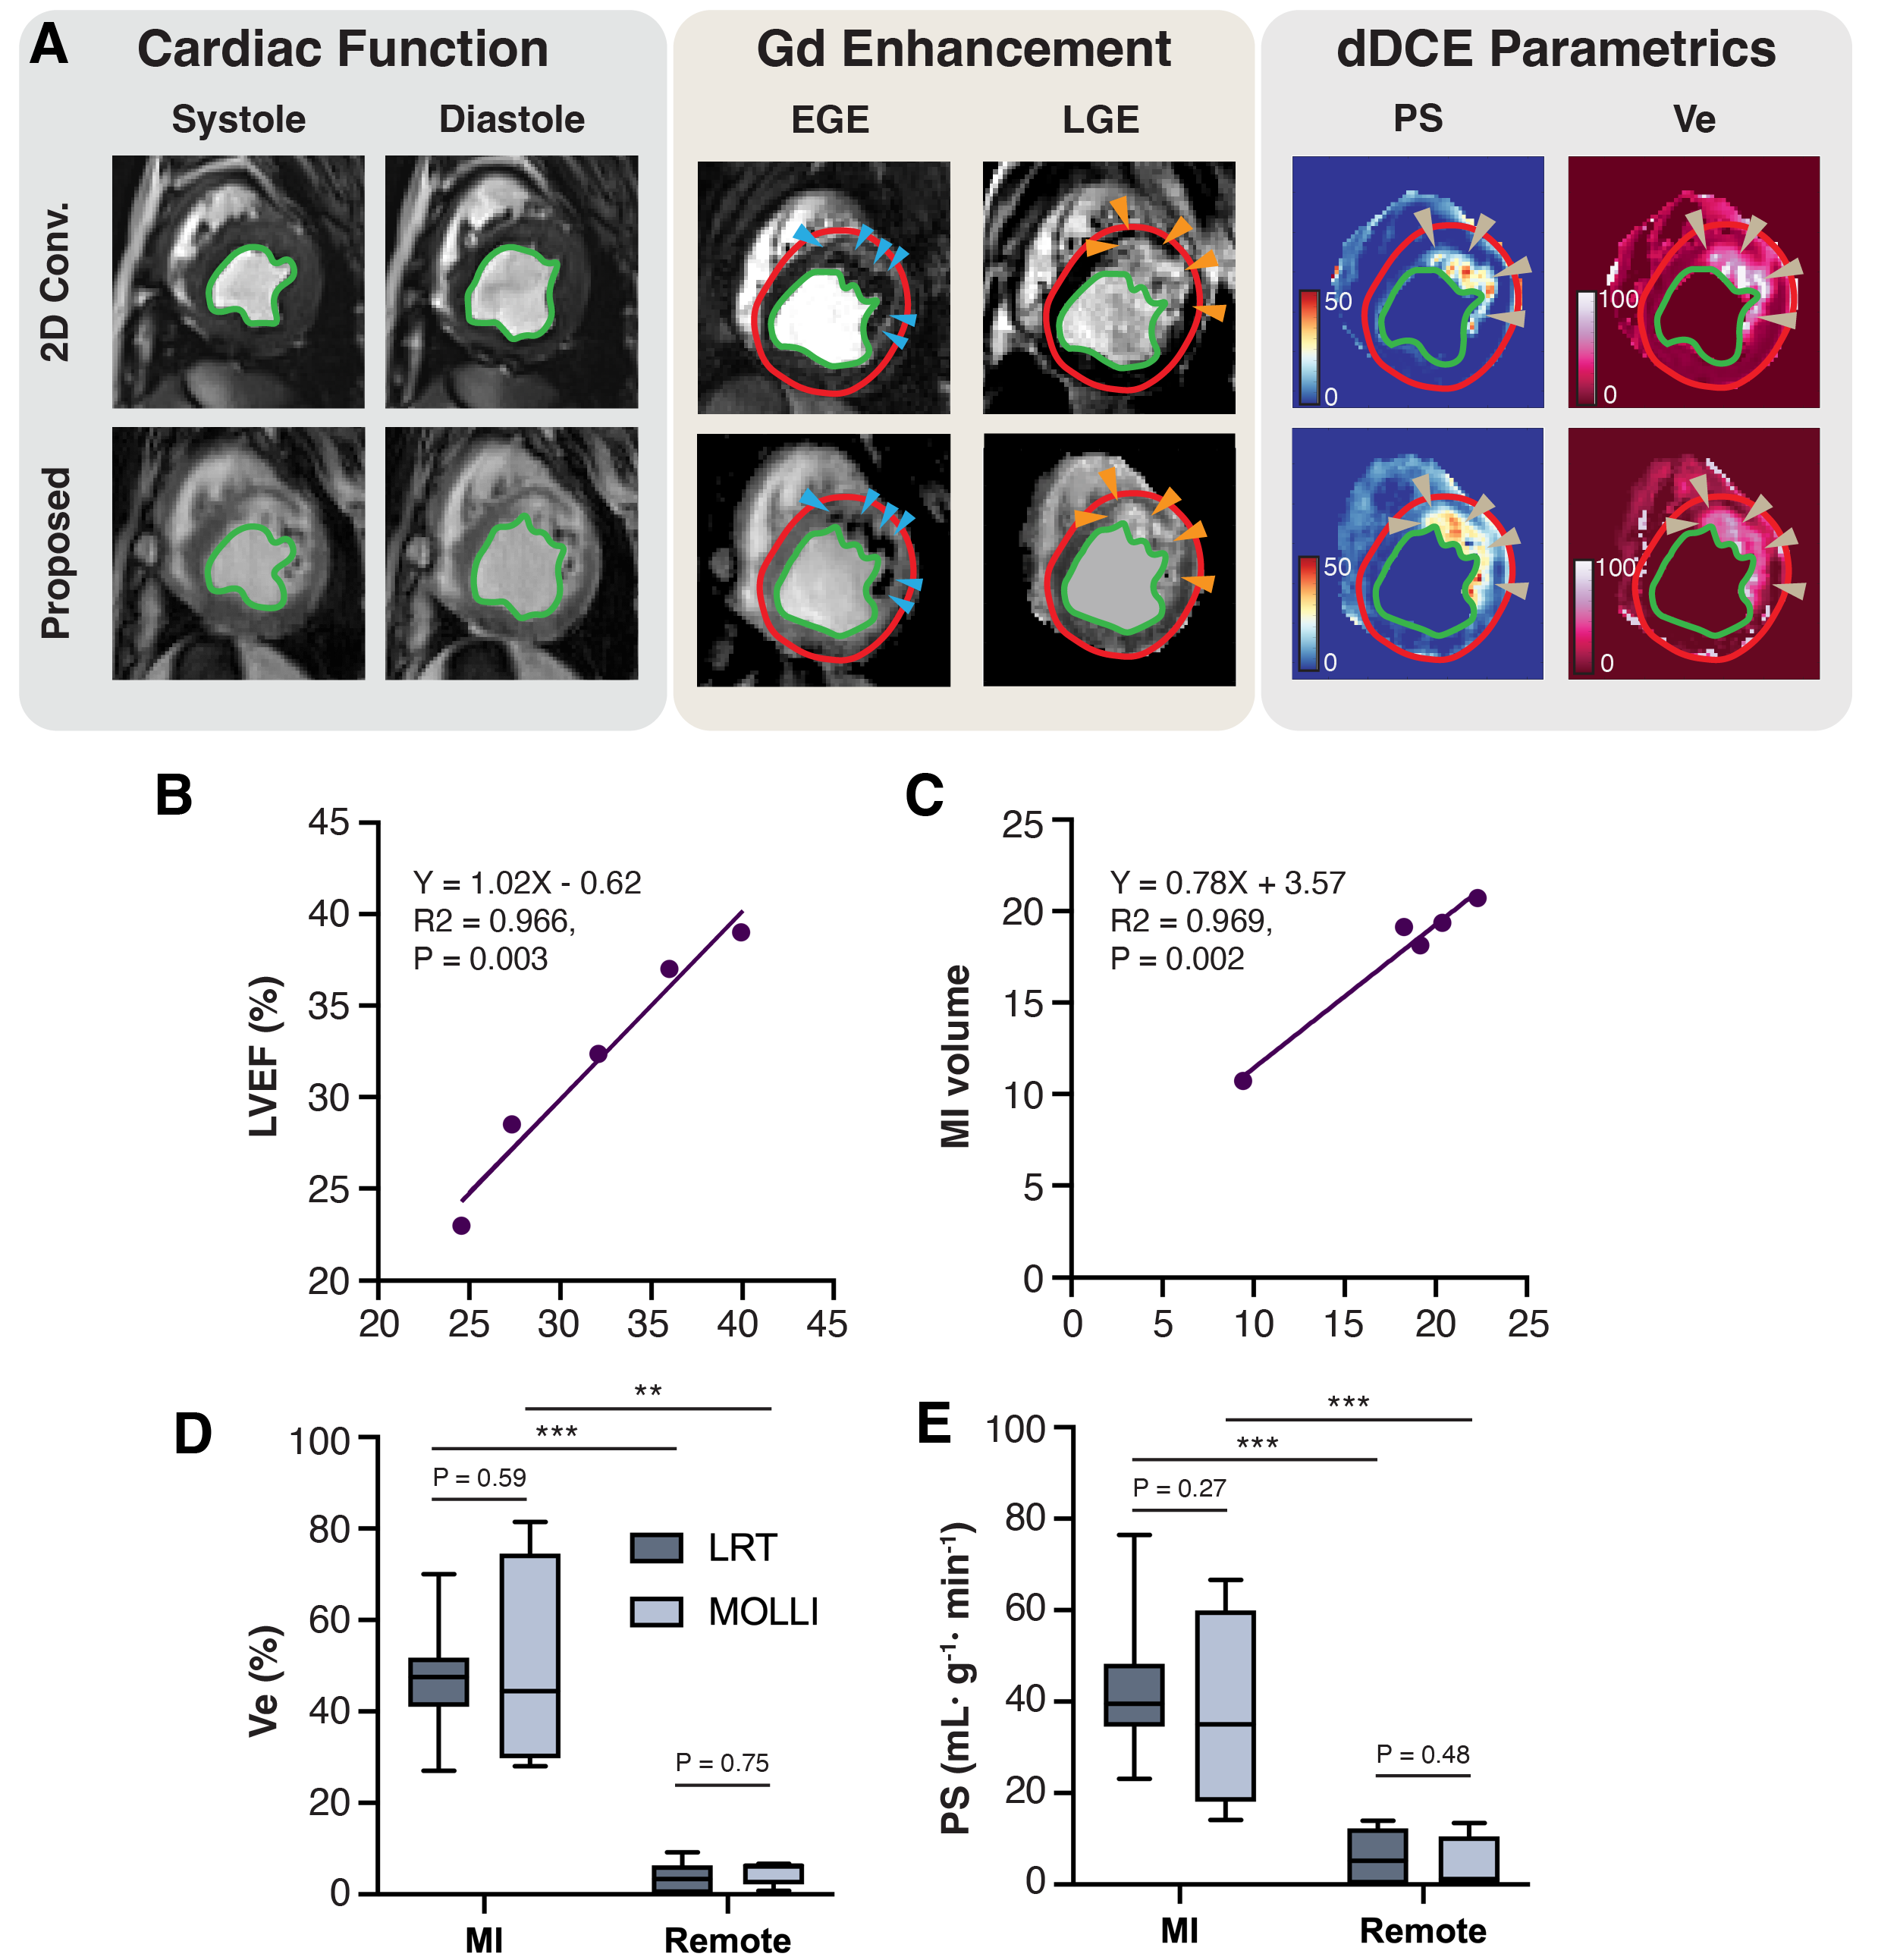