
Rapid Fire Session

Richard Hickstein, MD
Physician and Researcher
Charité – Universitätsmedizin Berlin
Berlin, Berlin, Germany
Richard Hickstein, MD
Physician and Researcher
Charité – Universitätsmedizin Berlin
Berlin, Berlin, Germany
Maximilian Fenski, MD
MD
Charité Berlin
Berlin, Berlin, Germany
Leo D Krüger
Medical Student
Charité Universitätsmedizin Berlin
Berlin, Berlin, Germany
Thomas Grandy, MD
Cardiac Electrophysiologist
Helios Klinikum Berlin Buch, Department of Cardiology and Nephrology, Germany

Clemens Ammann, MD
Physician
Charité – Universitätsmedizin Berlin
Berlin, Berlin, Germany

Thomas C. R Hadler, PhD
Postgraduate
Charité - Universitätsmedizin Berlin
Berlin, Berlin, Germany
André Rudolph, MD
Consultant Cardiologist
HELIOS Hospital Berlin-Buch, Germany
Michaela Schmidt
Applications Developer
Siemens Healthineers
Erlangen, Bayern, Germany
.jpg "Karl P. Kunze, PhD photo")
Karl P. Kunze, PhD
Senior Cardiac MR Scientist
Siemens Healthineers
Camberley, England, United Kingdom
Michael Wiedemann, MD
Consultant Cardiologist
HELIOS Hospital Berlin-Buch, Germany

Jeanette Schulz-Menger, MD
Head Working Group Cardiac MRI
Charité/ University Medicine Berlin and Helios
Berlin, Berlin, Germany
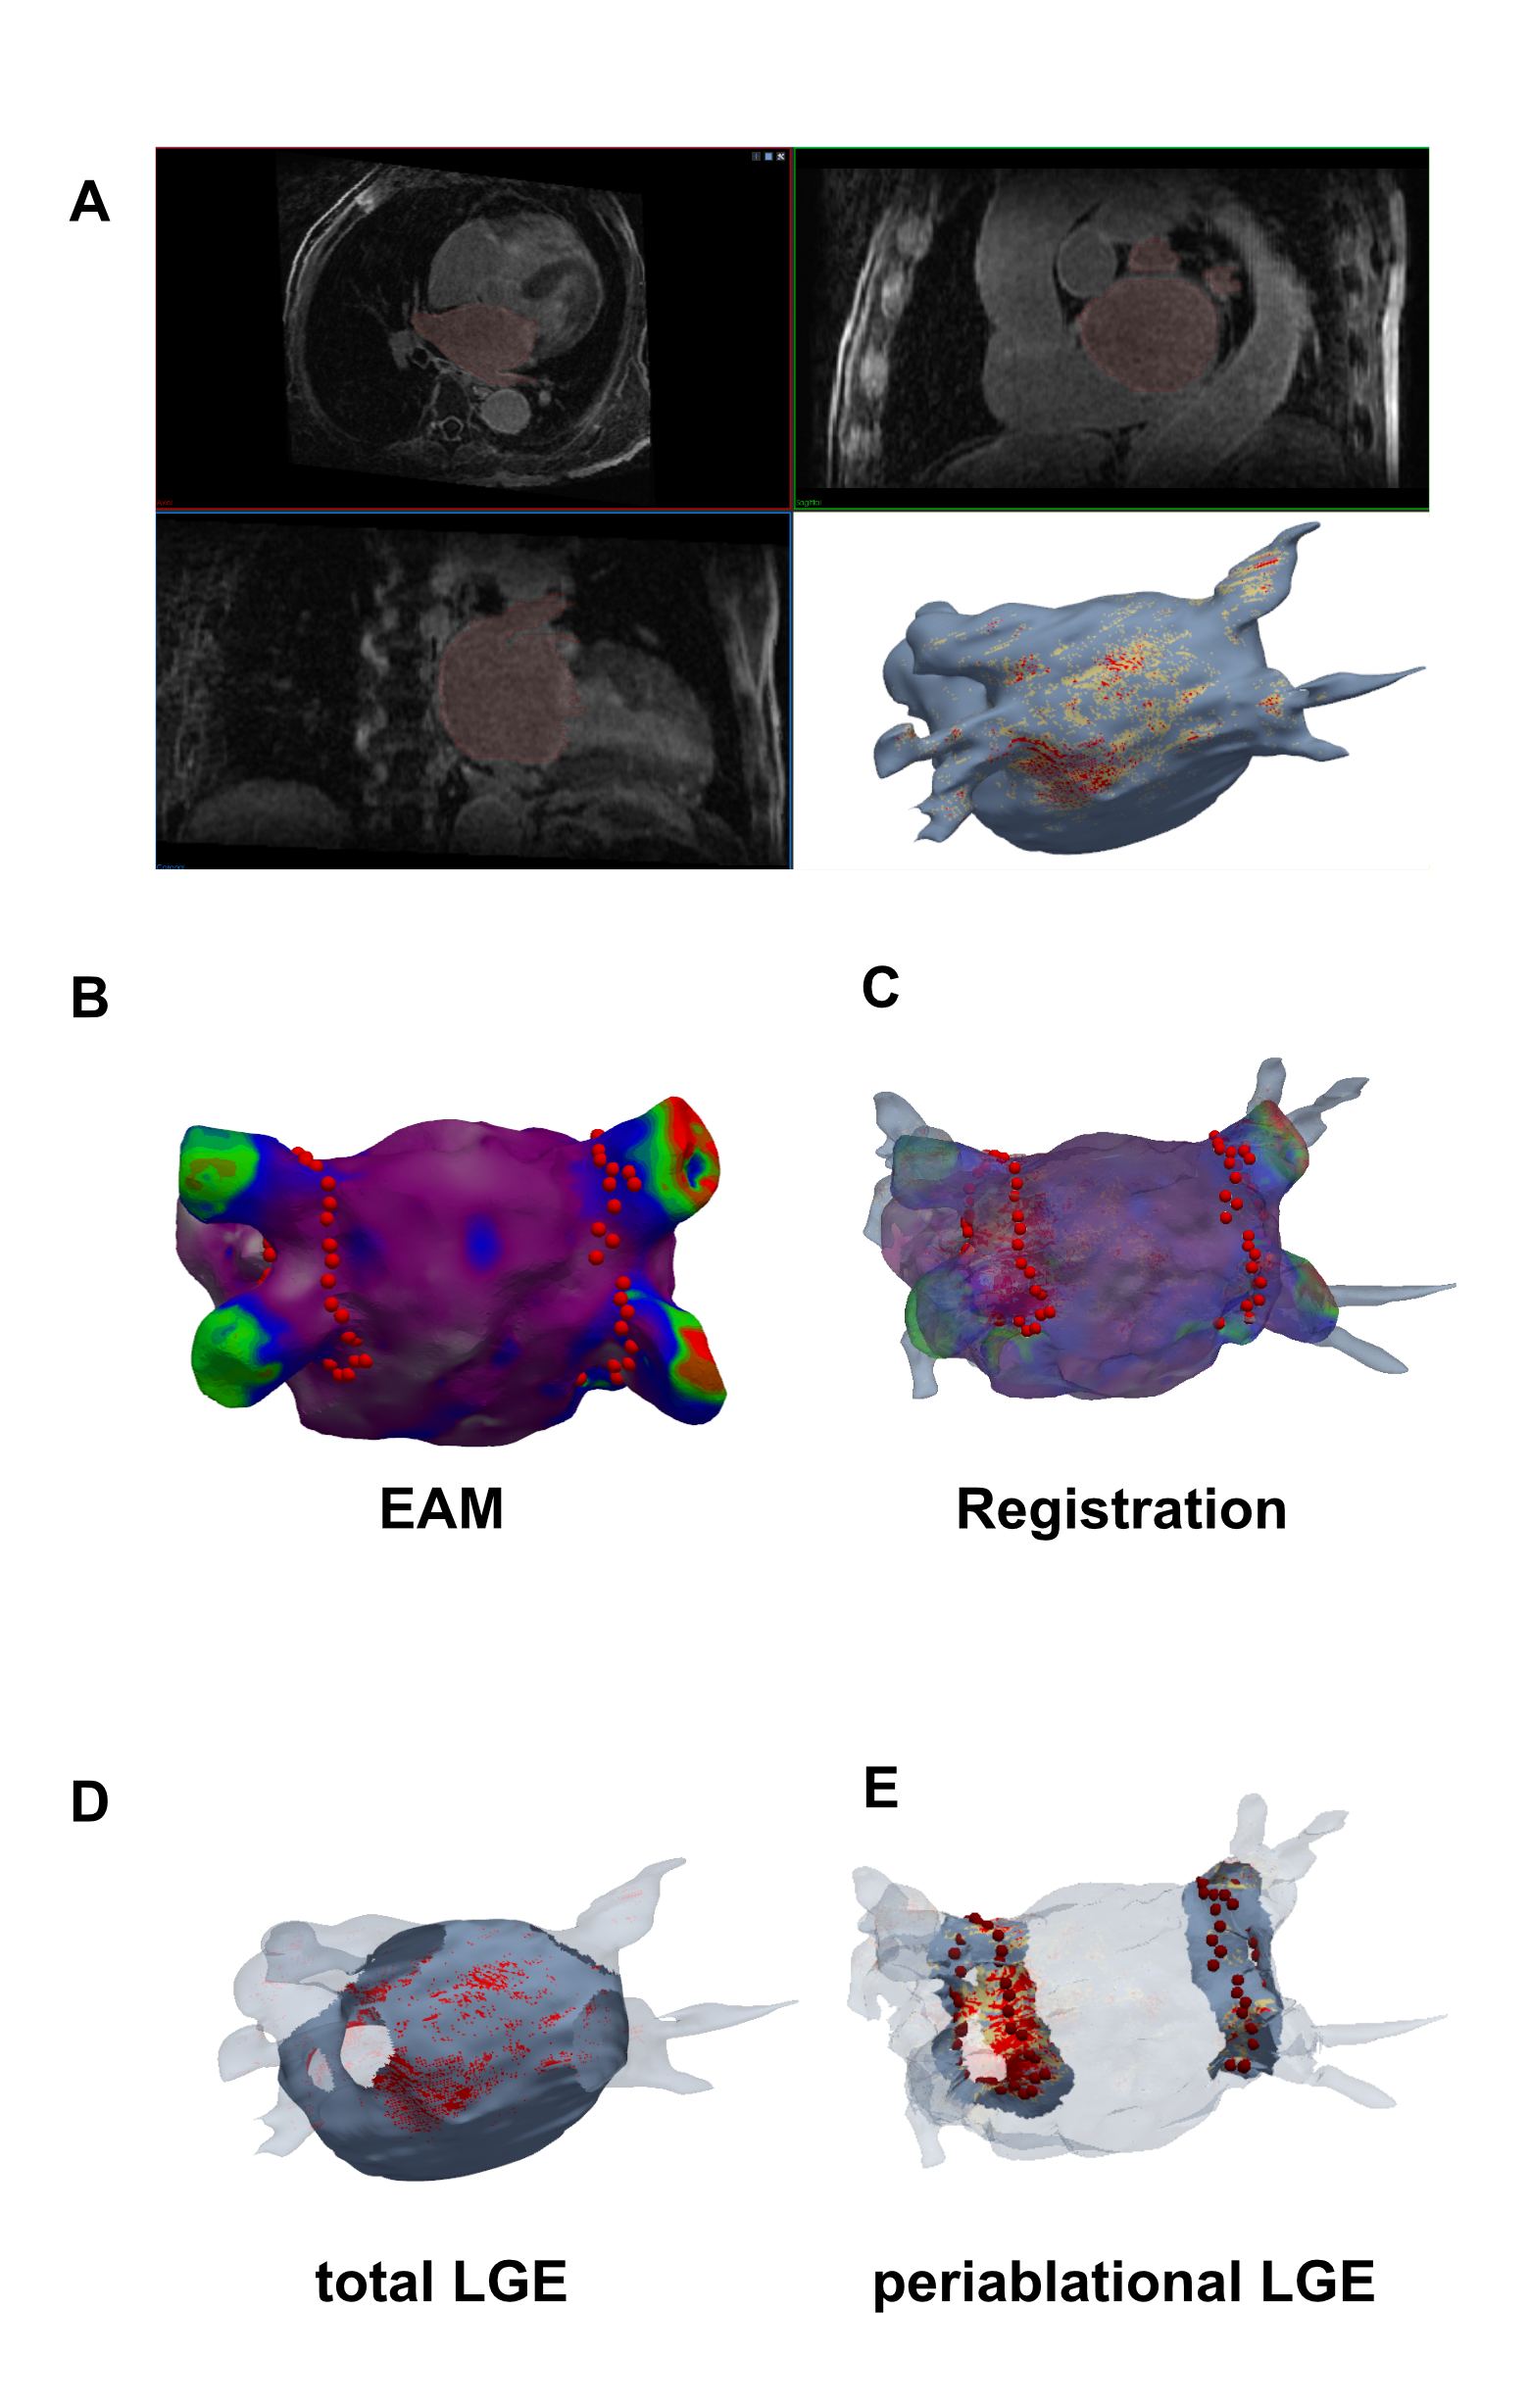 Figure 2: Total LGE in paroxysmal and persistent AF at Baseline and 6 months after PVI. At baseline, isotropic 3D LGE Dixon imaging enabled differentiation between patients with persistent and paroxysmal atrial fibrillation based on total fibrotic substrate burden. Six months after the PVI procedure, an increase in total LGE percentage was observed in both groups (paroxysmal p<0.001, persistent: p=0.24, Wilcoxon signed rank test). Boxplots represent median (solid line inside the box), interquartile range (IQR, box) and Q1 - 1.5*IQR or Q3 + 1.5*IQR (whiskers) of the total left atrial LGE amount.
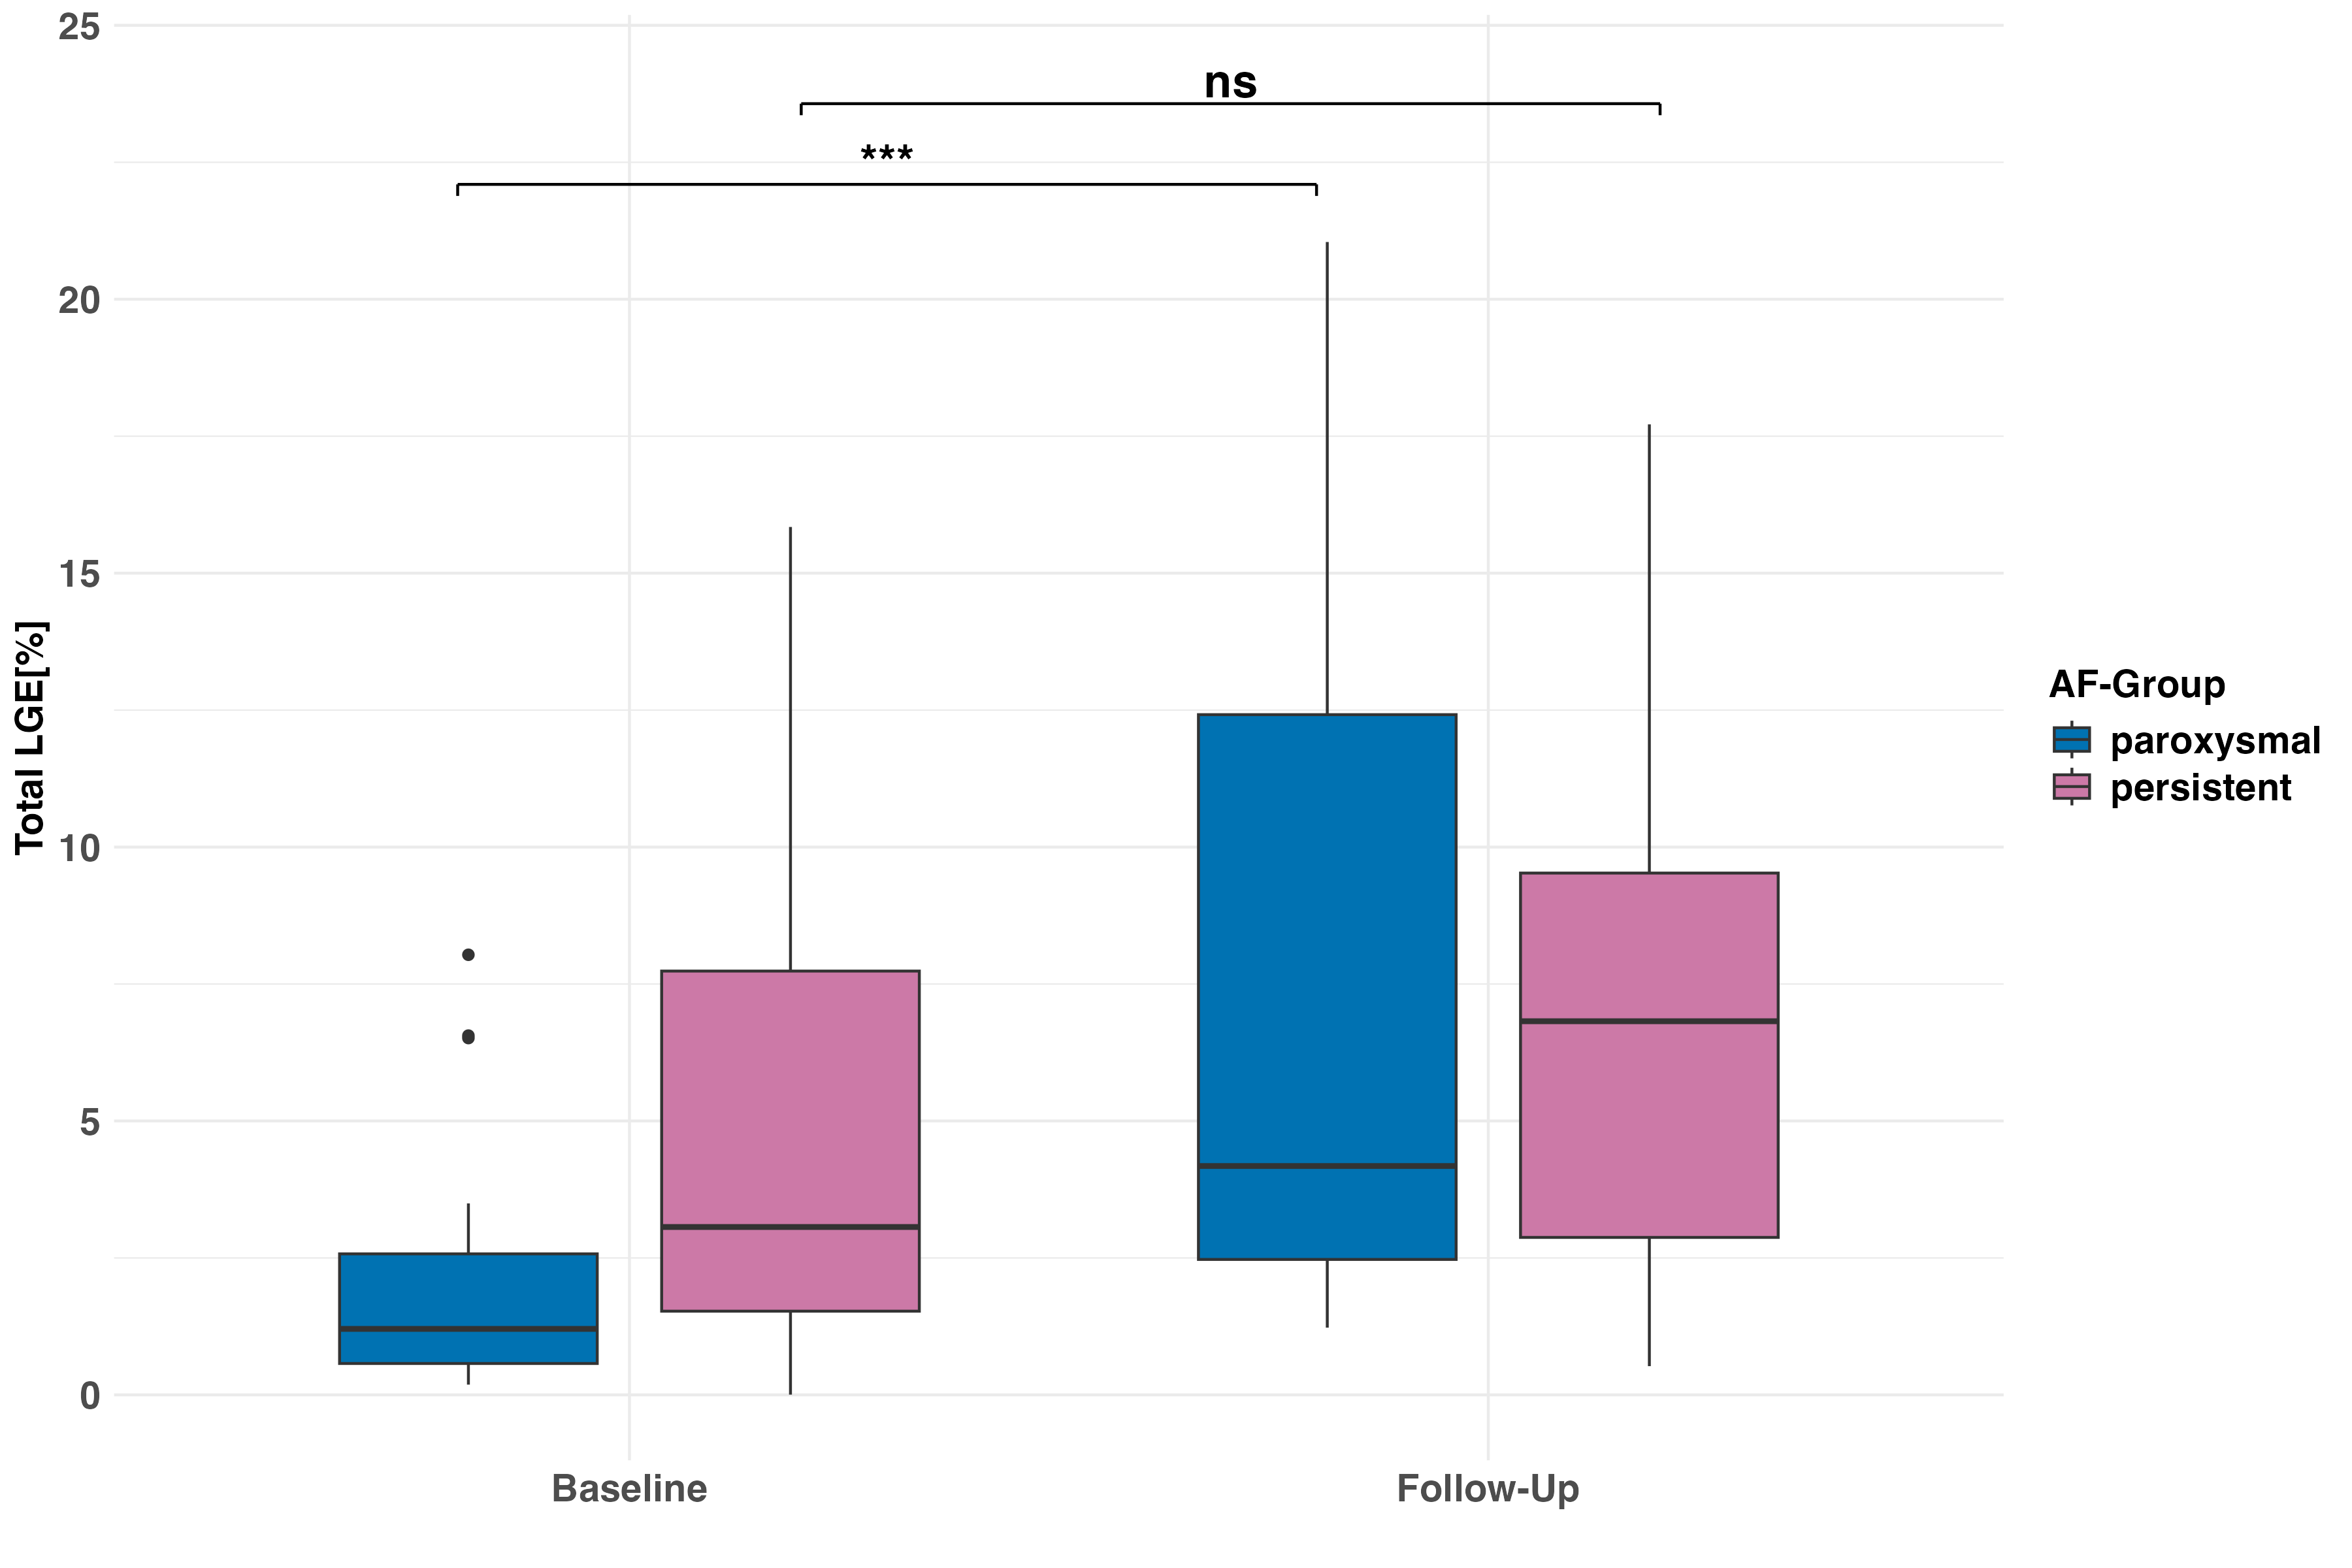 Figure 3: Spatial correlation of ablation sites from electroanatomic mapping (EAM) with isotropic Late Gadolinium Enhancement (LGE) enables quantitative assessment of ablation-induced fibrosis. EAM ablation sites spatially correlated with the LGE reconstruction can be seen in the left half of the plot. Red dots indicate ablation sites, image intensity ratios >1.34 marked in red, image intensity ratios >1.2 marked in yellow. Note that for quantification of scar amount in the remote (non-ablated) LA wall, pulmonary veins, LA appendage and mitral valve were excluded from the quantification. The right side shows the quantitative LGE analysis in the peri-ablational area and the remote LA wall. At 6 months post-PVI, changes in fibrotic substrate were observed predominantly in the peri-ablational area (right, p<0.001, Wilcoxon signed-rank test), with no significant changes in the remote LA wall (left, p=0.375, Wilcoxon signed-rank test). Boxplots represent median (solid line inside the box), interquartile range (IQR, box) and Q1 - 1.5*IQR or Q3 + 1.5*IQR (whiskers) of the left atrial LGE amount in the non-ablated remote LA-Wall (left) and periablational area (right).
.png)
