
Rapid Fire Session

Anna Charlotte Tuinman, MD
PhD candidate, MD
Amsterdam Medical Center
Amsterdam, Noord-Holland, Netherlands
Anna Charlotte Tuinman, MD
PhD candidate, MD
Amsterdam Medical Center
Amsterdam, Noord-Holland, Netherlands

Luuk H.G.A Hopman, PhD
Postdoctoral Researcher Cardiology
Amsterdam UMC
Amsterdam, Noord-Holland, Netherlands
Sophie van der Geest
Graduate student
Amsterdam UMC, Zuid-Holland, Netherlands
Philippe van Rosendael, MD, PhD
MD, PhD
Leiden University Medical Center, Netherlands
Marco J.W Götte, MD, PhD
MD, PhD
Stephenson Cardiac Imaging Centre
Calgary, Alberta, Canada
Vokko van Halm, MD, PhD
dr.
Amsterdam Medical Center, Netherlands
Cornelis Allaart, MD, PhD
VU university medical center, Amsterdam, Netherlands
| Univariable | Multivariable |
| Univariable | Multivariable | ||||||
HR (95% CI) | p-value | HR (95% CI) | p-value |
| HR (95% CI) | p-value | HR (95% CI) | p-value | |||
Age (years) | 0.993 (0.936 – 1.055) | 0.83 |
|
| Age (years) | 1.098 (1.047 – 1.152) | < .001 | 1.082 (1.029 – 1.136) | 0.002 | ||
Sex (male) | 0.338 (0.091 – 1.253) | 0.11 |
|
| Sex (male) | 0.663 (0.336 – 1.307) | 0.24 |
|
| ||
BMI (kg/m2) | 1.110 (0.981 – 1.255) | 0.10 |
|
| BMI (kg/m2) | 1.022 (0.945 – 1.105) | 0.59 |
|
| ||
Hypertension | 1.331 (0.621– 2.852) | 0.46 |
|
| Hypertension | 1.017 (0.646 – 1.601) | 0.94 |
|
| ||
Diabetes | 1.038 (0.281 – 3.837) | 0.96 |
|
| Diabetes | 1.093 (0.491 – 2.435) | 0.83 |
|
| ||
Hypercholesteremia | 1.411 (0.723 – 2.755) | 0.31 |
|
| Hypercholesteremia | 1.144 (0.770 – 1.700) | 0.51 |
|
| ||
History to AF | 1.598 (0.988 – 2.582) | 0.06 | 3.044 (0.838 – 11.053) | 0.09 | History to AF | 1.318 (0.934 – 1.861) | 0.12 |
|
| ||
Creatinine (µmol/L) | 1.008 (0.996 – 1.020) | 0.21 |
|
| Creatinine (µmol/L) | 1.012 (1.005 – 1.019) | < .001 | 1.010 (1.002 – 1.018) | 0.01 | ||
NYHA class | 0.372 (0.151 – 0.917) | 0.03 | 0.095 (0.007 – 1.396) | 0.09 | NYHA class | 0.846 (0.525 – 1.365) | 0.49 |
|
| ||
LVEF (%) | 1.005 (0.934 – 1.081) | 0.90 |
|
| LVEF (%) | 0.979 (0.938 – 1.021) | 0.32 |
|
| ||
QRS duration (msec) | 1.001 (0.970 – 1.032) | 0.96 |
|
| QRS duration (msec) | 1.004 (0.986 – 1.023) | 0.64 |
|
| ||
Non-LBBB | 0.536 (0.161 – 1.789) | 0.31 |
|
| Non-LBBB | 0.471 (0.233 – 0.954) | 0.04 | 0.488 (0.221 – 1.075) | 0.08 | ||
Amiodarone | 1.263 (0.163 – 9.794) | 0.82 |
|
| Amiodarone | 1.295 (0.395 – 4.249) | 0.67 |
|
| ||
Beta blocker | 0.660 (0.178 – 2.441) | 0.53 |
|
| Beta blocker | 1.171 (0.484 – 2.834) | 0.73 |
|
| ||
ACE or ATII antagonist | 0.666 (0.143 – 3.043) | 0.60 |
|
| ACE or ATII antagonist | 0.573 (0.250 – 1.316) | 0.19 |
|
| ||
MRA | 2.169 (0.651 – 7.222) | 0.21 |
|
| MRA | 0.962 (0.488 – 1.894) | 0.91 |
|
| ||
LGE on CMR | 0.602 (0.150 – 2.410) | 0.47 |
|
| LGE on CMR | 0.702 (0.331 – 1.492) | 0.36 |
|
| ||
LGE pattern | 2.458 (0.265 – 22.794) | 0.43 |
|
| LGE pattern | 0.889 (0.327 – 2.419) | 0.82 |
|
| ||
LGE burden | 1.085 (0.898 – 1.310) | 0.40 |
|
| LGE burden | 0.943 (0.781 – 1.138) | 0.54 |
|
| ||
SSI on CMR | 1.050 (0.870 – 1.266) | 0.61 |
|
| SSI on CMR | 0.998 (0.895 – 1.113) | 0.97 |
|
| ||
* Univariable and multivariable analyses of ADT and mortality during follow-up. Hazard ratios (HR) with 95% confidence intervals (CI) and p-values are presented for each variable.
Abbreviations: ADT = appropriate device therapy; BMI = body mass index; AF = atrial fibrillation; NYHA = New York Heart Association; LVEF = left ventricular ejection fraction; LBBB = left bundle branch block; ACE = angiotensin converting enzyme; ATII = angiotensin II; MRA = mineralocorticoid receptor antagonist; LGE = late gadolinium enhancement; CMR = cardiac magnetic resonance; SSI = systolic stretch index. Figure 1. LGE Patterns and Mechanical Dyssynchrony in NICM Patients Undergoing CRT-D Implantation. Distribution of late gadolinium enhancement (LGE) patterns and systolic stretch index (SSI) in non-ischemic cardiomyopathy patients undergoing CRT-D implantation. Pie chart shows the proportion of LGE patterns; scatter plot displays SSI distribution above and below the median of 8.96. Median follow-up was 5 years.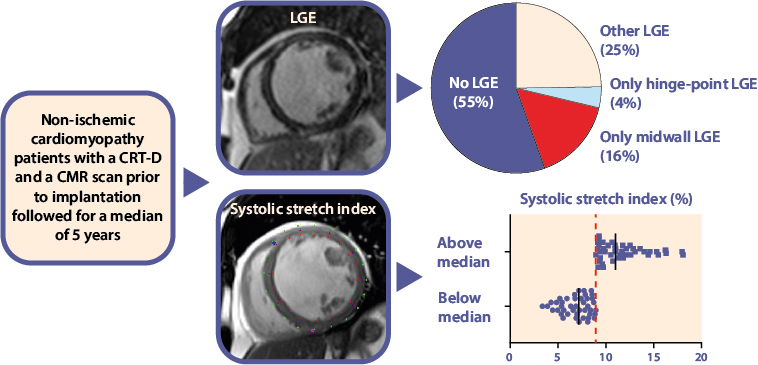 Figure 2. Kaplan Meier curves for ADT and mortality in NICM CRT-D patients. Panel A: Kaplan-Meier analysis stratified by LGE-positive and LGE-negative CRT-D patients, showing the occurrence of appropriate device therapy (ADT), p = 0.63. Panel B: Kaplan-Meier analysis stratified by LGE-positive and LGE-negative CRT-D patients, showing mortality, p = 0.35. Panel C: Kaplan-Meier analysis stratified by SSI high and SSI low CRT-D patients, showing the occurrence of ADT, p = 0.78. Panel D: Kaplan-Meier analysis stratified by SSI high and SSI low CRT-D patients, showing the occurrence of mortality, p = 0.69.
.jpg)
