Rapid Fire Session

Björn Wieslander, MD, PhD
MD PhD
Karolinska Institutet and Region Kronoberg
Stockholm, Stockholms Lan, Sweden
Björn Wieslander, MD, PhD
MD PhD
Karolinska Institutet and Region Kronoberg
Stockholm, Stockholms Lan, Sweden
Eric E. Morgan, MD, PhD
Clinical Fellow
National Heart, Lung, and Blood Institute, National Institutes of Health
Bethesda, Maryland, United States
Nina Castor, MSc
Medical student
Karolinska Institutet
Hägersten, Stockholms Lan, Sweden

Ahsan Javed, PhD
Staff Scientist
National Heart, Lung, and Blood Institute, National Institutes of Health
Vienna, Virginia, United States
Jelena Krsmanovic, MSc
Msc
Karolinska University Hospital, Stockholms Lan, Sweden

Alexander Fyrdahl, PhD
Medical Physicist
Karolinska Institutet
Stockholm, Stockholms Lan, Sweden

Gaby Weissman, MD
Physician
Medstar Washington Medical Center
Washington, District of Columbia, United States

Adrienne E E. Campbell-Washburn, PhD
Principal Investigator
National Heart, Lung, and Blood Institute, National Institutes of Health
Bethesda, Maryland, United States
.jpg "Felicia Seemann, PhD photo")
Felicia Seemann, PhD
Assistant Professor
Karolinska Institutet
Bethesda, Maryland, United States
Characteristics | All patients | Non-HF | HF with EF ≥50 % | HF with EF < 50 % | NYHA I-II | NYHA III-IV | P-value (HF vs non-HF) |
N | 34 | 11 | 5 | 18 | 19 | 4 |
|
Basic characteristics |
|
|
|
|
|
|
|
Age – years | 59.5 ±12.9 | 58.5 ±16.7 | 54.6 ± 12.6 | 61.5 ± 11.3 | 59.4 ± 11.7 | 62.5 ± 12.7 | n.s. |
Sex – female (%) | 18 (51) | 9 (82) | 4 (80) | 5 (28) | 7 (37) | 2 (50) | 0.03 |
BMI – kg/m2 | 29.7 ± 6.9 | 29.1 ± 6.1 | 29.8 ± 9.8 | 30.0 ± 6.8 | 30.1 ± 7.9 | 29.3 ± 4.1 | n.s. |
BSA – m2 | 2.03 ± 0.26 | 1.95 ± 0.26 | 2.05 ± 0.23 | 2.07 ± 0.27 | 2.08 ± 0.26 | 2.03 ± 0.24 | n.s. |
Height – cm | 172 ± 8 | 168 ± 5 | 174 ± 6 | 174 ± 9 | 174 ± 8 | 172 ± 11 | n.s. |
Weight – kg | 87 ± 21 | 83 ± 19 | 89 ± 23 | 90 ± 21 | 90 ± 22 | 87 ± 16 | n.s. |
Disease history |
|
|
|
|
|
|
|
Atrial fibrillation at CMR - n (%) | 1 (3) | 0 (0) | 0 (0) | 1 (6) | 1 (5) | 0 (0) | n.s. |
Diabetes – n (%) | 12 (359 | 3 (37) | 0 (0) | 9 (50) | 7 (37) | 2 (50) | n.s. |
Hypertension – n (%) | 21 (62) | 7 (64) | 2 (40) | 12 (67) | 11 (58) | 3 (75) | n.s. |
Hyperlipidemia – n (%) | 21 (62) | 8 (73) | 2 (40) | 11 (61) | 11 (58) | 2 (50) | n.s. |
History of smoking – n (%) | 3 (9) | 1 (9) | 1 (20) | 1 (6) | 2 (11) | 0 (0) | n.s. |
Heart failure diagnosis – n (%) | 23 (38) | 0 (0) | 5 (100) | 18 (100) | 19 (100) | 4 (100) |
|
Medications |
|
|
|
|
|
|
|
ACEi/ARB – n (%) | 21 (62) | 3 (27) | 2 (40) | 16 (89) | 14 (74) | 4 (100) | 0.008 |
ARNI – n (%) | 15 (44) | 1 (9) | 0 (0) | 14 (78) | 10 (53) | 4 (100) | 0.008 |
Beta blocker – n (%) | 22 (65) | 5 (45) | 2 (40) | 15 (83) | 13 (68) | 4 (100) | n.s. |
Loop diuretic – n (%) | 10 (29) | 2 (18) | 0 (0) | 8 (44) | 5 (26) | 3 (75) | n.s. |
Other diuretic – n (%) | 8 (24) | 3 (27) | 0 (0) | 5 (28) | 4 (21) | 1 (25) | n.s. |
SGLT2-inhibitor – n (%) | 13 (38) | 1 (9) | 0 (0) | 12 (67) | 10 (53) | 2 (50) | 0.023 |
|
|
|
|
|
|
|
|
CMR findings |
|
|
|
|
|
|
|
LVEF | 49 (35-60) | 63 (60-66) | 56 (52-58) | 35 (29-41) | 41 (33-50) | 30 (23-36) | < 0.001 |
Ischemic LGE | 6 (18) | 0 (0) | 0 (0) | 6 (33) | 4 (21) | 2 (50) | n.s |
Primary CMR diagnosis |
|
|
|
|
|
|
|
-Ischemic cardiomyopathy | 4 (12) | 0 (0) | 0 (0) | 4 (22) | 3 (16) | 1 (25) | n.s |
-Nonischemic cardiomyopathy | 15 (44) | 0 (0) | 3 (60) | 12 (67) | 13 (68) | 2 (50) | < 0.001 |
-Storage or infiltrative disease | 1 (3) | 0 (0) | 0 (0) | 1 (6) | 1 (5) | 0 (0) | n.s |
-Hypertrophic cardiomyopathy | 2 (6) | 1 (9) | 0 (0) | 1 (6) | 0 (0) | 1 (25) | n.s |
-CMR findings within normal ranges | 11 (32) | 9 (82) | 2 (40) | 0 (0) | 2 (11) | 0 (0) | < 0.001 |
-Other | 1 (3) | 1 (9) | 0 (0) | 0 (0) | 0 (0) | 0 (0) | n.s. |
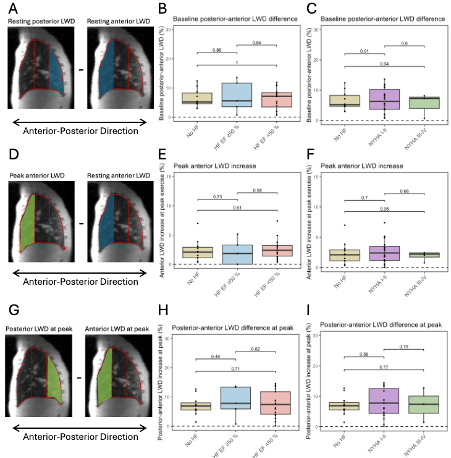
Abbreviations: ACEi - Angiotensin-Converting Enzyme inhibitor. ARB - Angiotensin II Receptor Blocker. ARNI - Angiotensin Receptor-Neprilysin Inhibitor. BMI - Body Mass Index. BSA - Body Surface Area. CMR - Cardiac Magnetic Resonance. LGE - Late Gadolinium Enhancement. LVEF - Left Ventricular Ejection Fraction. n.s. – not significant.The top row (panels A and B) shows the lung water density (LWD) measured at baseline, by ejection fraction (EF) and New York Heart Association (NYHA) class symptom severity. The middle row (panels C and D) shows the peak LWD increase during exercise, reported in percentage points. The bottom row (panels E an F) shows the dynamic LWD over time during the exercise protocol according to EF (panel E) and NYHA class (panel F), respectively. Transparent lines represent individual data points, whereas thick lines represent the group median LWD at each respective timeframe. Statistical comparisons were made using Student’s T-test or Mann Whitney U-test, as appropriate.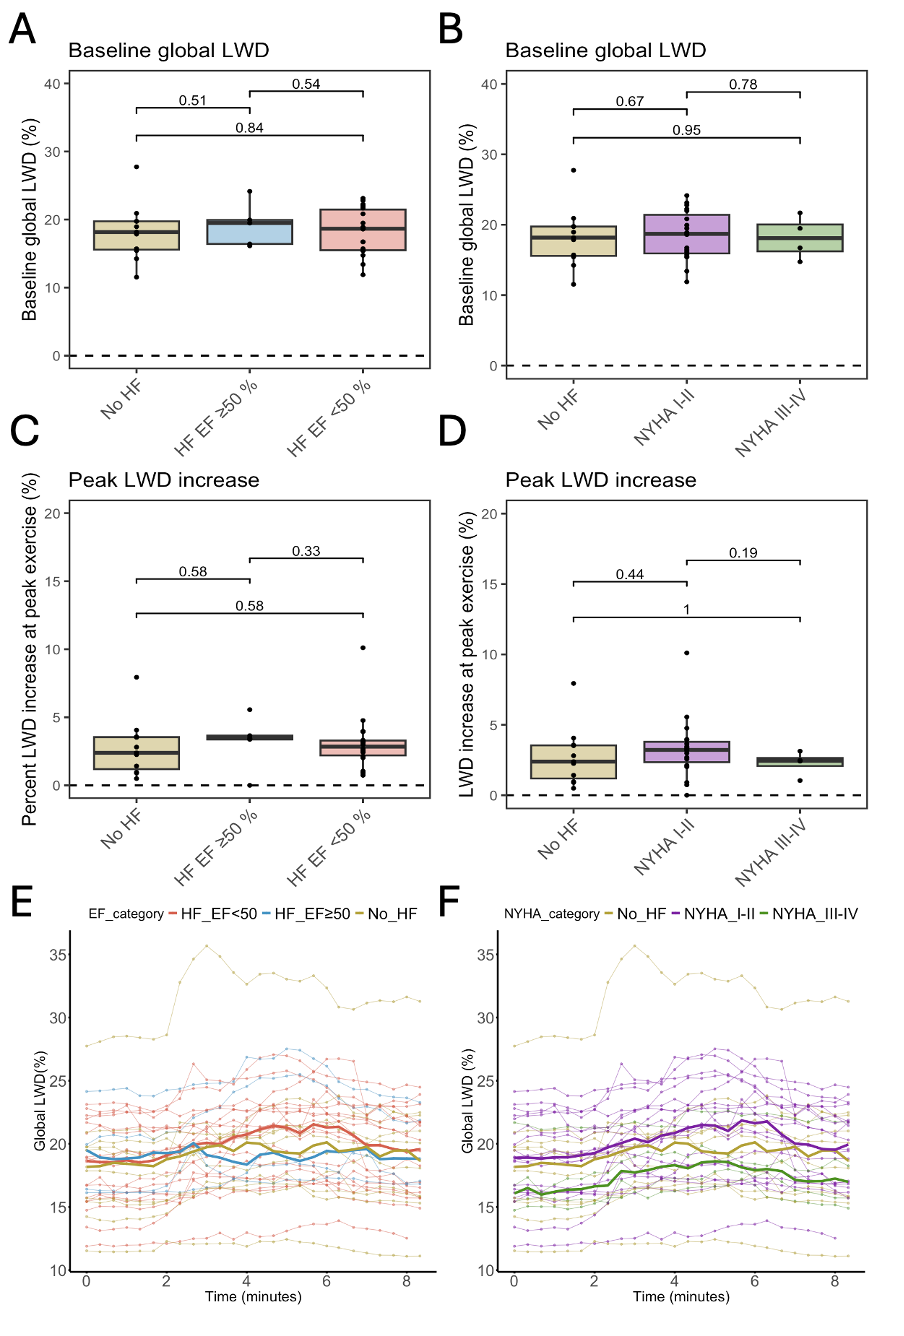 The top row shows the difference between resting posterior and anterior lung water density (LWD) (Panel A) with comparisons according to ejection fraction (EF) (Panel B) and New York Heart Association (NYHA) class (Panel C), respectively. The middle row shows the peak increase of LWD in the anterior third of the lungs (Panel D) by EF (Panel E) and NYHA (Panel F), respectively. The bottom row shows the difference between posterior and anterior LWD (Panel G) at the time of peak global LWD increase by EF (Panel H) and NYHA class (Panel I), respectively. Statistical comparisons were made using Student’s T-test or Mann Whitney U-test, as appropriate.