Oral Abstracts Session
Virtual Recording
Thomas P. Skacel, BEng
MD/PhD Student
University of Virginia
Charlottesville, Virginia, United States
Thomas P. Skacel, BEng
MD/PhD Student
University of Virginia
Charlottesville, Virginia, United States
Nemati Saleh, N/A
Undergraduate Student
University of Virginia
Charlottesville, Virginia, United States
Kenny Quach, BA
Medical Student
University of Virginia, United States
Caitlin Pavelec, PhD
Post Doctoral Fellow
University of Virginia
Charlottesville, Virginia, United States
Leigh Bradley
Lab Manager
University of Virginia, United States
Julia Bresticker, MS
MD/PhD Student
University of Virginia
Charlottesville, Virginia, United States

Amit R. Patel, MD, FSCMR
Professor of Medicine
Division of Cardiology, University of Virginia Health System, Charlottesville, Virginia, USA.
Charlottesville, Virginia, United States
Matthew J. Wolf, MD, PhD
Associate Professor
University of Virginia
Charlottesville, Virginia, United States

Frederick H. Epstein, PhD
Professor
University of Virginia
Charlottesville, Virginia, United States
.png) Figure 2: A) EAT volume normalized to body weight before and after 5 days of treatment. B) Example SFA maps overlaid on regions of EAT in short-axis images from the same animal before and after SEMA treatment. C) EAT SFA index in mice before and after 5 days of treatment. D) Myocardial PDFF before and after 28-day treatment. Statistical analysis was performed using two-way repeated measures ANOVA with Tukey’s post hoc tests. Data are presented as mean ± SD. *p < 0.05, **p < 0.01, ****p < 0.0001. Abbreviations as in text.
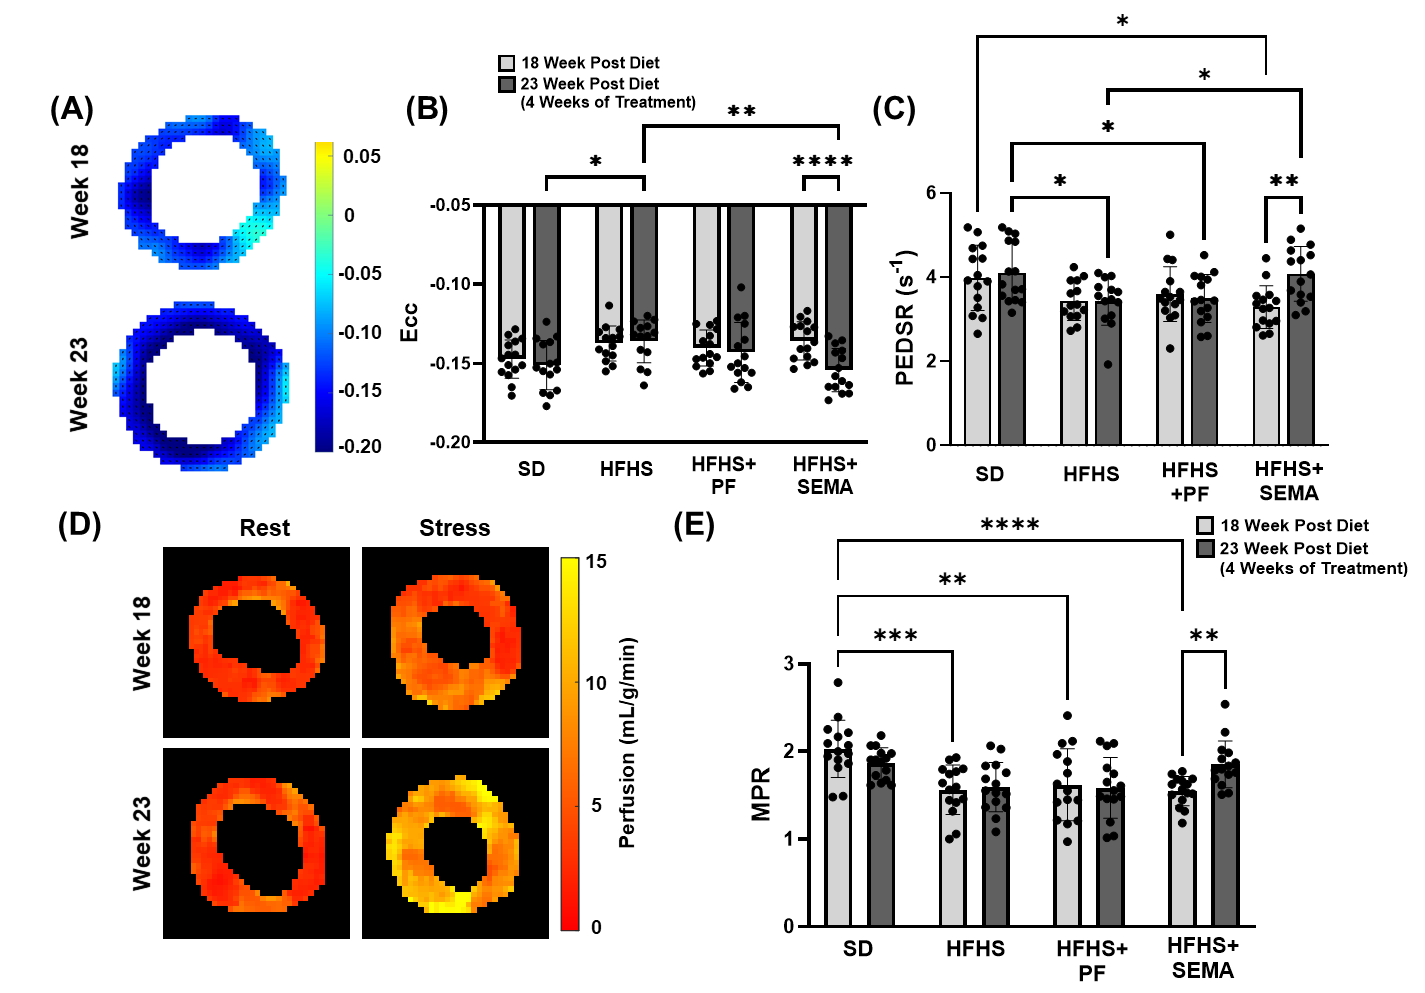
Figure 2: A) EAT volume normalized to body weight before and after 5 days of treatment. B) Example SFA maps overlaid on regions of EAT in short-axis images from the same animal before and after SEMA treatment. C) EAT SFA index in mice before and after 5 days of treatment. D) Myocardial PDFF before and after 28-day treatment. Statistical analysis was performed using two-way repeated measures ANOVA with Tukey’s post hoc tests. Data are presented as mean ± SD. *p < 0.05, **p < 0.01, ****p < 0.0001. Abbreviations as in text.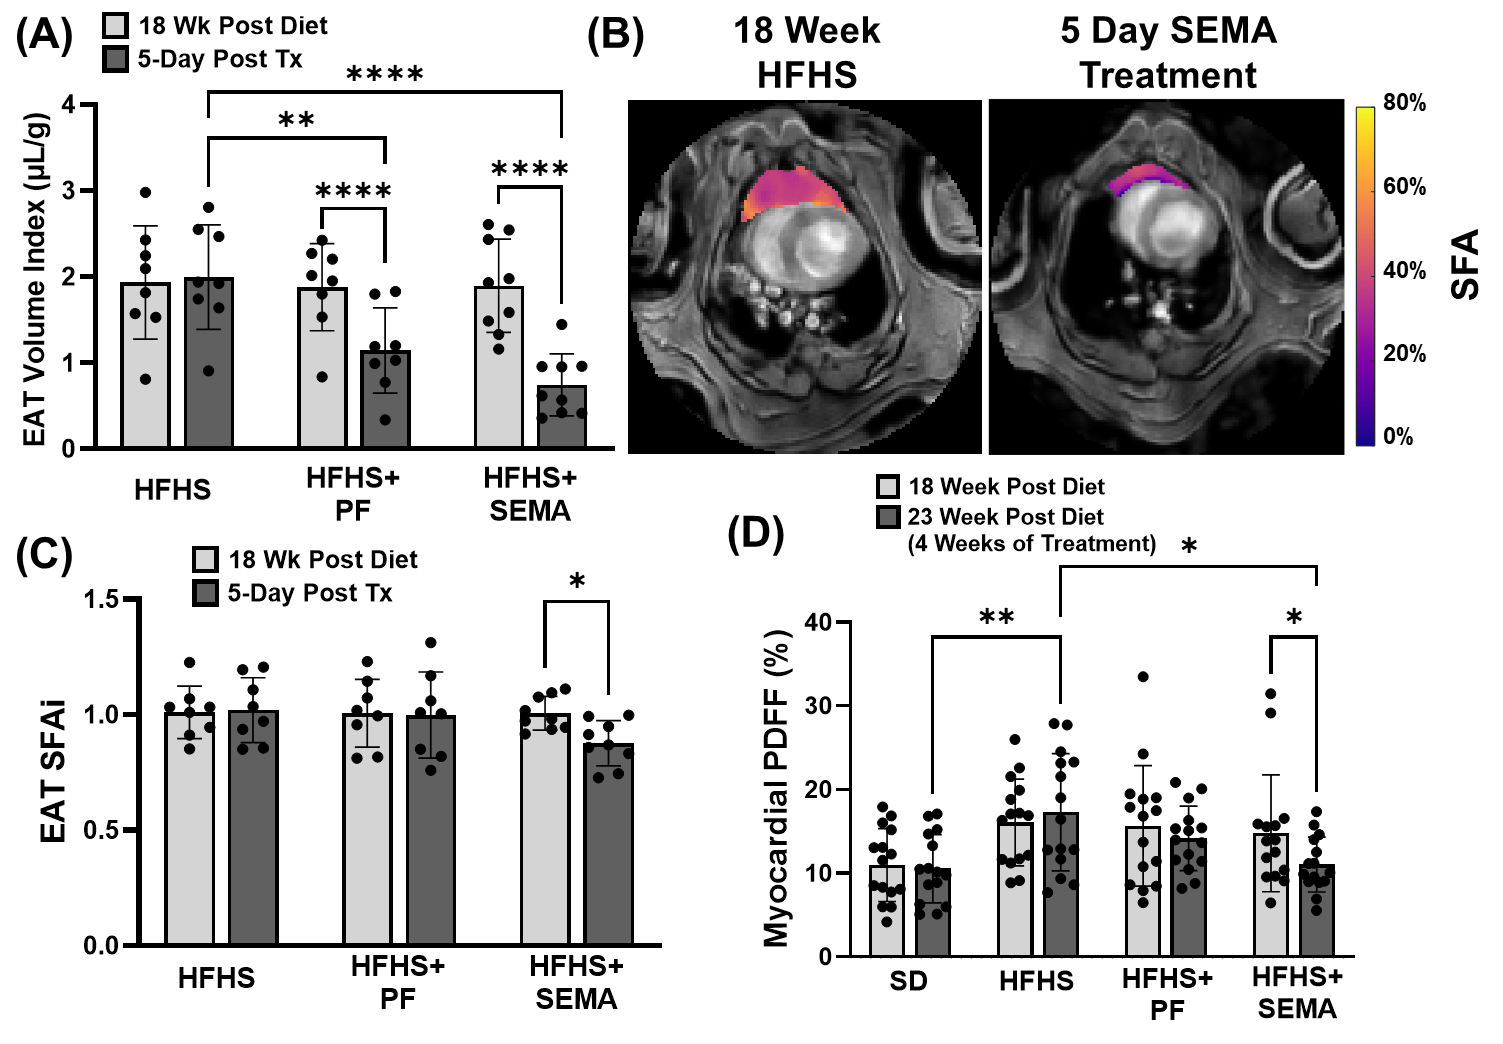 Figure 3: A) Example circumferential strain maps from the same animal before and after SEMA treatment. B) Circumferential strain (Ecc) and C) peak early diastolic strain rate (PEDSR) before and after 28-day SEMA treatment from DENSE imaging. D) Example rest and stress perfusion maps from the same animal before and after SEMA treatment. E) Myocardial perfusion reserve before and after 28-day SEMA treatment. Statistical analysis was performed using two-way repeated measures ANOVA with Tukey’s post hoc tests. Data are presented as mean ± SD. *p < 0.05, **p < 0.01, ***p < 0.001, ****p < 0.0001. Abbreviations as in text.