Late Breaking Clinical Trials
Virtual Recording
Thipsumon Tangsiwong, MD
Pediatric Cardiac Imaging Fellow
The Hospital for Sick Children
Toronto, Ontario, Canada
Thipsumon Tangsiwong, MD
Pediatric Cardiac Imaging Fellow
The Hospital for Sick Children
Toronto, Ontario, Canada
Matteo Ponzoni, MD
Clinical fellow
The Hospital for Sick Children, Canada
Osami Honjo,, MD
Head, Div of Cardiovas Surgery
The Hospital for Sick Children, Canada
.jpg "Christopher Z. Lam, MD photo")
Christopher Z. Lam, MD
Staff Radiologist
The Hospital for Sick Children
Toronto, Ontario, Canada
| N (%) |
Male (n=86) | 52 (60.5) |
Diagnosis (n=86) |
|
Tricuspid atresia | 25 (29.1) |
Hypoplastic left heart syndrome | 23 (26.7) |
Double inlet left ventricle | 13 (15.1) |
Atrioventricular septal defect | 9 (10.5) |
Double outlet right ventricle | 9 (10.5) |
Pulmonary stenosis with hypoplastic right ventricle | 3 (3.5) |
Pulmonary atresia-intact ventricular septum | 2 (2.3) |
Pulmonary atresia-ventricular septal defect | 1 (1.2) |
Double inlet right ventricle | 1 (1.2) |
Ventricular dominance |
|
Left | 44 (51.2) |
Right | 38 (44.2) |
Undetermine | 3 (3.5) |
Heterotaxy (n=86) | 4 (4.7) |
Type of Fontan (n=86) |
|
ECC | 79 (91.9) |
Lateral tunnel | 7 (8.1) |
ECC size at implantation (n=79) |
|
16 mm | 1 (1.2) |
20 mm | 14 (17.3) |
22 mm | 63 (77.8) |
24 mm | 1 (1.2) |
Unknown | 12 (2.5) |
Clinical History (n=86) Arrhythmias PLE Plastic bronchitis Admission for chylothorax Thrombosis Stroke Chronic kidney disease Cirrhosis PLE, plastic bronchitis, or admission for chylothorax |
11 (12.8) 6 (7) 1 (1.2) 4 (4.7) 6 (7) 2 (2.3) 2 (2.3) 2 (2.3) 11 (12.8) |
MRI findings (n=86) |
|
Age at MRI (years) [mean±SD] | 14.1±0.3 |
Duration from Fontan completion (years) [median (IQR)] | 10.8 (8.5-13.0) |
BSA (m2) [mean±SD] | 1.45±0.0 |
Portal lymphatic scores |
|
Grade 1 | 42 (48.8) |
Grade 2 | 39 (45.4) |
Grade 3 | 5 (5.8) |
Retroperitoneal lymphatic scores |
|
Grade 1 | 52 (60.5) |
Grade 2 | 30 (34.9) |
Grade 3 | 4 (4.6) |
ECC minimum diameter (mm) [mean±SD] | 15.5±0.2 |
ECC minimum cross-sectional area (mm2) [mean±SD] | 242.2±5.4 |
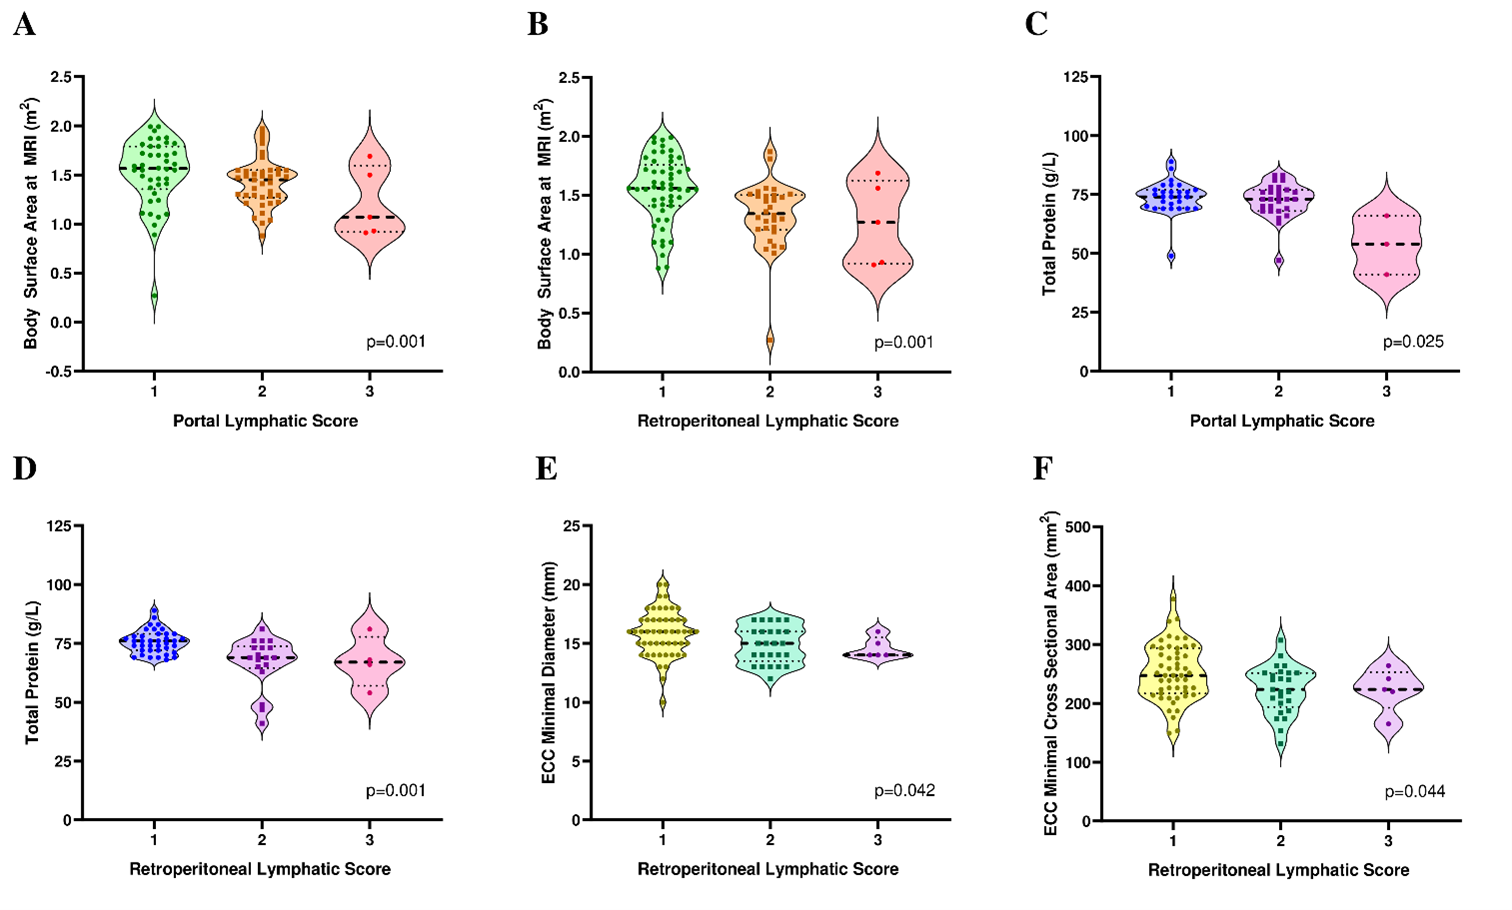
 Figure 2. Violin plots illustrating distribution of patient BSA at MRI (panel A and B), total serum protein (panel C and D), ECC minimal diameter (panel E), and ECC minimal cross sectional area (panel F), across lymphatic abnormality scores. Each point represents an individual data set, the lines represent median and Q1-Q3.