Oral Abstracts Session

Pieter J. Reitzema, MSc
PhD Student
University of Calgary
Dordrecht, Zuid-Holland, Netherlands
Pieter J. Reitzema, MSc
PhD Student
University of Calgary
Dordrecht, Zuid-Holland, Netherlands

Sara L. Schooten, MSc
Technical Medicine Master Student
Amsterdam UMC
Zwolle, Overijssel, Netherlands
Machteld J. Boonstra, PhD
Assistant professor
Amsterdam UMC, Netherlands

Luuk H.G.A Hopman, PhD
Postdoctoral Researcher Cardiology
Amsterdam UMC
Amsterdam, Noord-Holland, Netherlands

Eric M. Schrauben, PhD
Scientific Researcher
Amsterdam Medical Center
Toronto, Ontario, Netherlands
Jules Nelissen, PhD
x
Amsterdam Medical Center, Netherlands
Bart Smeets, MSc
R&D Engineer
LifeTec Group, Netherlands
Renate Boekhoven, PhD
R&D Manager
LifeTec Group
Eindhoven, Noord-Brabant, Netherlands

Jouke Smink, MSc
MR Clinical Scientist
Philips Healthcare
Best, Noord-Brabant, Netherlands
Pranav Bhagirath, MD, PhD
Senior Registrar
Amsterdam University Medical Center - VU medical center
Amsterdam, Noord-Holland, Netherlands
Aart J. Nederveen, PhD
Full professor
Amsterdam Medical Center, Netherlands
Marco J.W Götte, MD, PhD
MD, PhD
Stephenson Cardiac Imaging Centre
Calgary, Alberta, Canada
 ECG signal pre- and post-ablation aligned around the R-peak. ECG (in V) signal pre- and post-ablation aligned around the R-peak for 4 beats. In leads V1 and V2, the initial activation occurs slightly earlier before ablation (blue), with a delayed upstroke and lower amplitude post-ablation (orange), suggesting a shift in earliest activation away from these regions. V3-V6 show relatively preserved QRS morphology, but with reduced amplitude and slight delay in the ascending limb of the QRS complex post-ablation. The amplitude of R-waves appears to be reduced in V4-V6, consistent with ablation-induced changes in local depolarization. Overall, shortening of the QRS complex duration is evident post-ablation, especially in V5-V6.
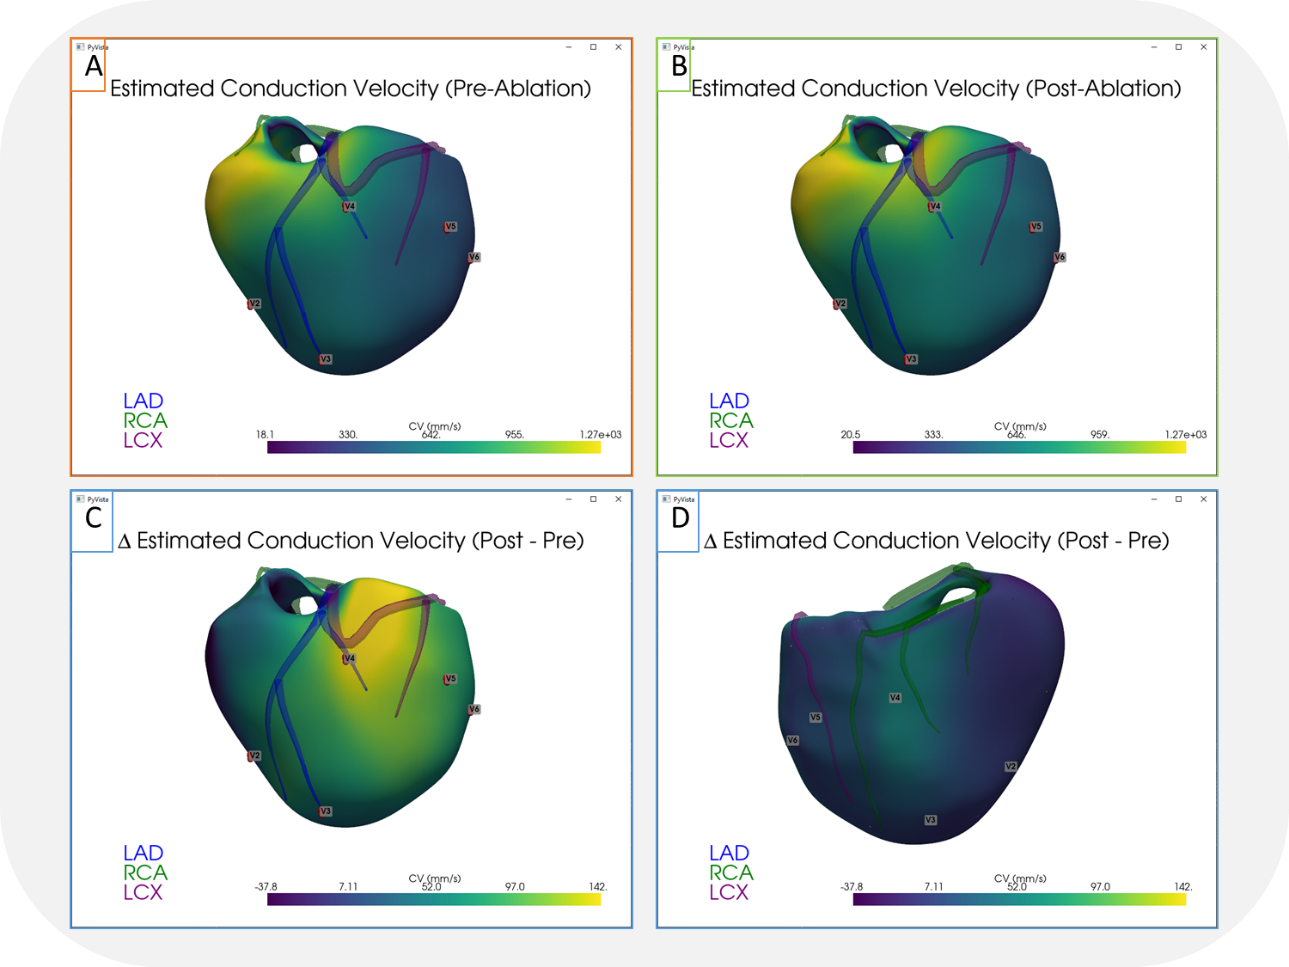
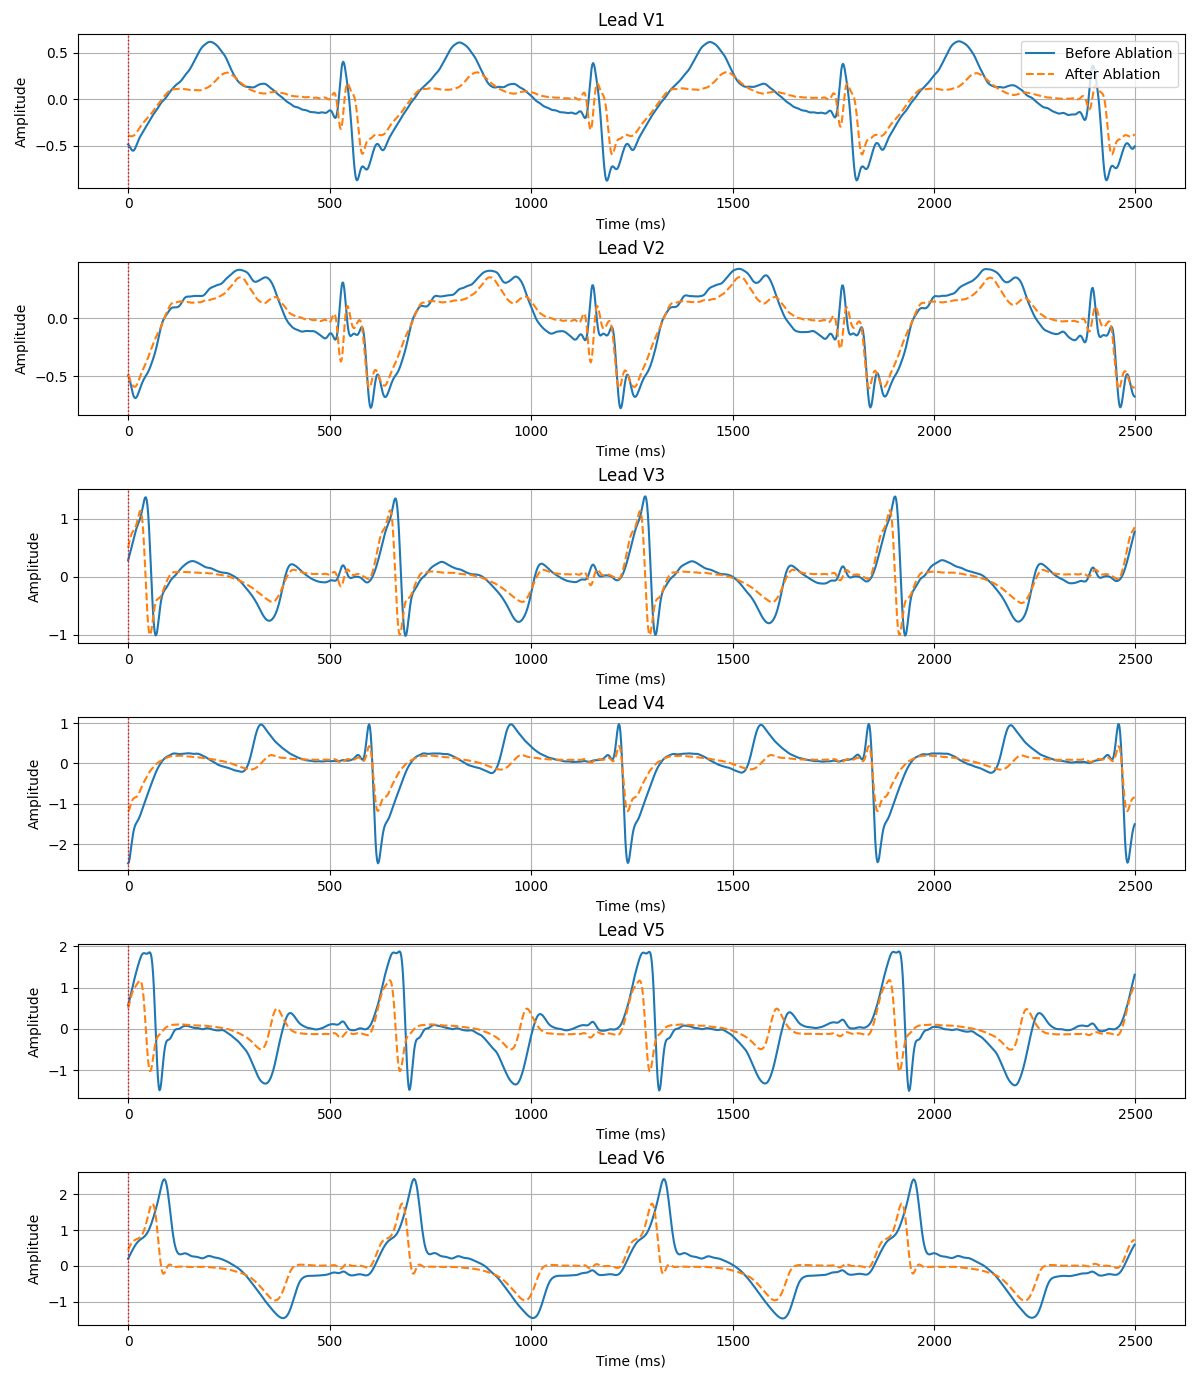 3D conduction velocity estimation maps for pre- and post-ablation and the difference between pre- and post-ablation. Conduction velocity (CV) estimates based on activation gradient before (Fig. 3A), and after (Fig. 3B) ablation, and the difference between the two (Fig. 3C-D). Purple and blue represent relative slow CV estimation, whereas green and yellow represent relative fast CV estimation. The difference in CV per triangle inside the mesh is shown in Figures 3C-D. A positive value indicates increased velocity, whereas a negative value shows decreased estimated CV post ablation.