Rapid Fire Session
.jpg "Malcolm L. Serran, BSc photo")
Malcolm L. Serran, BSc
MD Student
University of Toronto
Toronto, Ontario, Canada
Malcolm L. Serran, BSc
MD Student
University of Toronto
Toronto, Ontario, Canada
Rylan Marianchuk, BSc
Masters Student
University of Calgary
Calgary, Alberta, Canada

Justin J. Tse, PhD, MSc, BSc
Research Associate
University of Calgary
Calgary, Alberta, Canada
Eric P. Seidlitz, PhD
Assistant Professor
McMaster University, Ontario, Canada
Kim L. McBride, MD
Department Head
University of Calgary, Canada
Talia A. Beckie, BEng
Cardiac Imaging Systems Engineer
Libin cardiovascular Institute, University of Calgary
Calgary, Alberta, Canada
Sandra Rivest, RN
Research Coordinator
Libin Cardiovascular Institute; University of Calgary
Calgary, Alberta, Canada
Jacqueline Flewitt, MSc
Manager of Strategic Partnerships
Libin Cardiovascular Institute; University of Calgary
Calgary, Alberta, Canada
Noelle Mahon, RN
Research Nurse
University of Calgary, Canada
Yuanchao Feng, PhD
Senior AHS analyst
Libin Cardiovascular Institute; University of Calgary
Calgary, Alberta, Canada
Julian B. Neves, MSc
Junior Data Engineer
Libin Cardiovascular Institute, University of Calgary, Canada
Augustine Amakiri, PhD
Data Analyst
University of Calgary, Canada
Melanie King, PhD
Director, Program Development and Implementation
Libin Cardiovascular Institute, University of Calgary, Canada
Omid B. Kiamanesh, MD
Director
University of Calgary, Canada

James A. White, MD
Professor
Libin Cardiovascular Institute; University of Calgary
Calgary, Alberta, Canada

Dina Labib, MD, PhD, FSCMR
Associate Scientific Director, Personalized Diagnostics Program; Adjunct Assistant Professor
University of Calgary
Calgary, Alberta, Canada
Values are represented as median (Q1, Q3) or counts (%)
LV denotes left ventricle; EDV, end diastolic volume; ESV, end systolic volume; EF, ejection fraction; RV, right ventricle; LA, left atrial; and LGE, late gadolinium enhancementTable 1. CMR characteristics of healthy volunteers and muscular dystrophy subgroups
Characteristic HVN = 100 Dystrophinopathies N = 41 DM1 N = 42 DM2 N = 17 LGMD N = 20 p-value Age, y 46.0 (30.0, 54.0) 27.0 (20.0, 36.0) 40.5 (31.0, 55.0) 52.0 (42.0, 60.0) 50.0 (31.5, 56.5) < 0.001 Male sex 46 (46%) 41 (100%) 18 (43%) 7 (41%) 13 (65%) < 0.001 Conventional CMR measures LV EDV Indexed to Height, mL/m 88.1 (78.0, 99.7) 96.6 (72.4, 111.8) 77.9 (70.2, 93.6) 69.2 (59.5, 100.0) 82.1 (65.5, 104.4) 0.075 LV ESV Indexed to Height, mL/m 31.4 (26.6, 38.2) 47.6 (32.6, 58.0) 33.1 (25.6, 39.0) 27.0 (24.4, 45.0) 35.0 (26.4, 51.5) 0.001 LV EF, % 63.0 (61.0, 67.0) 54.0 (46.5, 58.9) 58.8 (53.8, 63.7) 59.0 (57.4, 62.1) 56.4 (51.0, 61.4) < 0.001 LV Mass Indexed to Height, g/m 50.8 (42.5, 62.9) 55.5 (48.4, 60.9) 44.8 (37.6, 56.5) 46.5 (38.7, 62.0) 54.5 (40.3, 65.7) 0.10 RV EDV Indexed to Height, mL/m 96.9 (85.6, 108.8) 84.7 (60.0, 93.2) 82.2 (67.5, 92.6) 73.9 (65.6, 106.7) 80.1 (63.9, 99.3) < 0.001 RV ESV Indexed to Height, mL/m 41.6 (33.6, 49.3) 39.3 (25.8, 43.9) 34.4 (28.1, 42.8) 31.5 (25.1, 53.9) 38.9 (29.4, 45.8) 0.042 RV EF 57.0 (53.5, 62.0) 54.1 (52.2, 59.4) 56.0 (52.2, 59.6) 56.4 (52.5, 61.5) 55.3 (49.1, 58.8) 0.23 LA Volume Indexed to Height, mL/m 38.6 (32.7, 46.8) 31.2 (21.3, 40.5) 30.1 (21.7, 35.6) 35.4 (25.2, 40.0) 38.2 (33.9, 48.2) < 0.001 LGE imaging Any LGE Pattern - 31 (76%) 12 (29%) 6 (35%) 10 (50%) < 0.001 Sub-Endocardial - 3 (8%) 0 (0%) 0 (0%) 0 (0%) 0.15 Mid-wall Striae - 9 (23%) 2 (5%) 1 (7%) 3 (15%) 0.092 RV Insertion Site - 3 (8%) 6 (14%) 3 (21%) 3 (15%) 0.50 Mid-wall Patchy - 15 (38%) 3 (7%) 2 (14%) 2 (10%) 0.003 Sub-Epicardial - 25 (63%) 2 (5%) 2 (14%) 6 (30%) < 0.001 Diffuse LGE - 0 (0%) 1 (2%) 0 (0%) 0 (0%) >0.99 Fibrosis/scar % - 7.4 (0.0, 16.2) 0.0 (0.0, 0.0) 0.0 (0.0, 1.5) 0.0 (0.0, 7.4) < 0.001 4Deep CMR Measures LV EDV Indexed to Height, mL/m 108.6 (91.3, 125.8) 127.8 (84.8, 145.3) 101.2 (79.3, 124.4) 85.6 (75.0, 95.1) 103.0 (91.1, 132.8) 0.050 LV ESV Indexed to Height, mL/m 45.6 (35.6, 53.0) 57.8 (40.9, 77.6) 47.7 (34.9, 61.2) 33.3 (29.8, 41.4) 58.8 (36.0, 80.9) 0.003 LV EF, % 59.6 (55.9, 62.6) 50.2 (41.3, 56.3) 53.8 (49.7, 58.9) 57.3 (52.8, 60.2) 49.9 (41.0, 61.4) < 0.001 LV mass Indexed to Height, g/m 49.8 (43.4, 61.1) 51.5 (46.7, 58.4) 44.4 (38.4, 53.5) 47.7 (37.8, 58.1) 51.7 (42.9, 62.1) 0.059 Maximum Wall Thickness, mm 11.0 (9.8, 13.1) 11.8 (9.4, 12.4) 10.7 (10.0, 12.7) 11.4 (9.7, 12.9) 11.9 (9.9, 14.2) 0.93 Mean Maximum Principal Strain, % 67.2 (59.2, 78.4) 54.3 (44.6, 70.1) 53.9 (45.4, 65.7) 71.6 (63.3, 80.5) 64.9 (41.9, 79.9) < 0.001 Mean Minimum Principal Strain, % -22.8 (-24.6, -20.6) -21.0 (-22.5, -17.6) -20.9 (-25.0, -18.9) -21.9 (-23.0, -21.3) -22.4 (-24.2, -20.1) 0.005
Values are represented as median (Q1, Q3) or counts (%)
LV denotes left ventricle; EDV, end diastolic volume; ESV, end systolic volume; EF, ejection fraction;
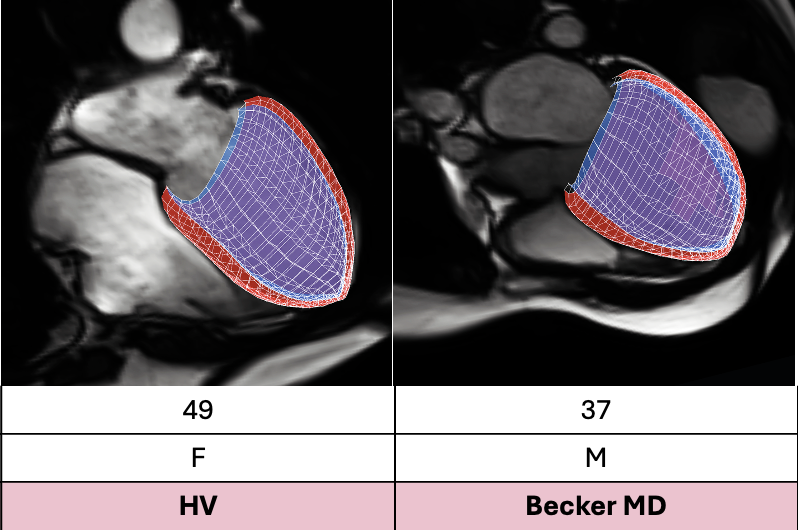
RV, right ventricle; LA, left atrial; and LGE, late gadolinium enhancement Figure 1. AHA segmental distribution of height indexed LV mass and max principal strain in HV and the MD subgroups. DM1 denotes type 1 myotonic dystrophy; DM2, type 2 myotonic dystrophy; Dys, dystrophinoapthy; HV, healthy volunteers; and LGMD, limb girdle muscular dystrophy.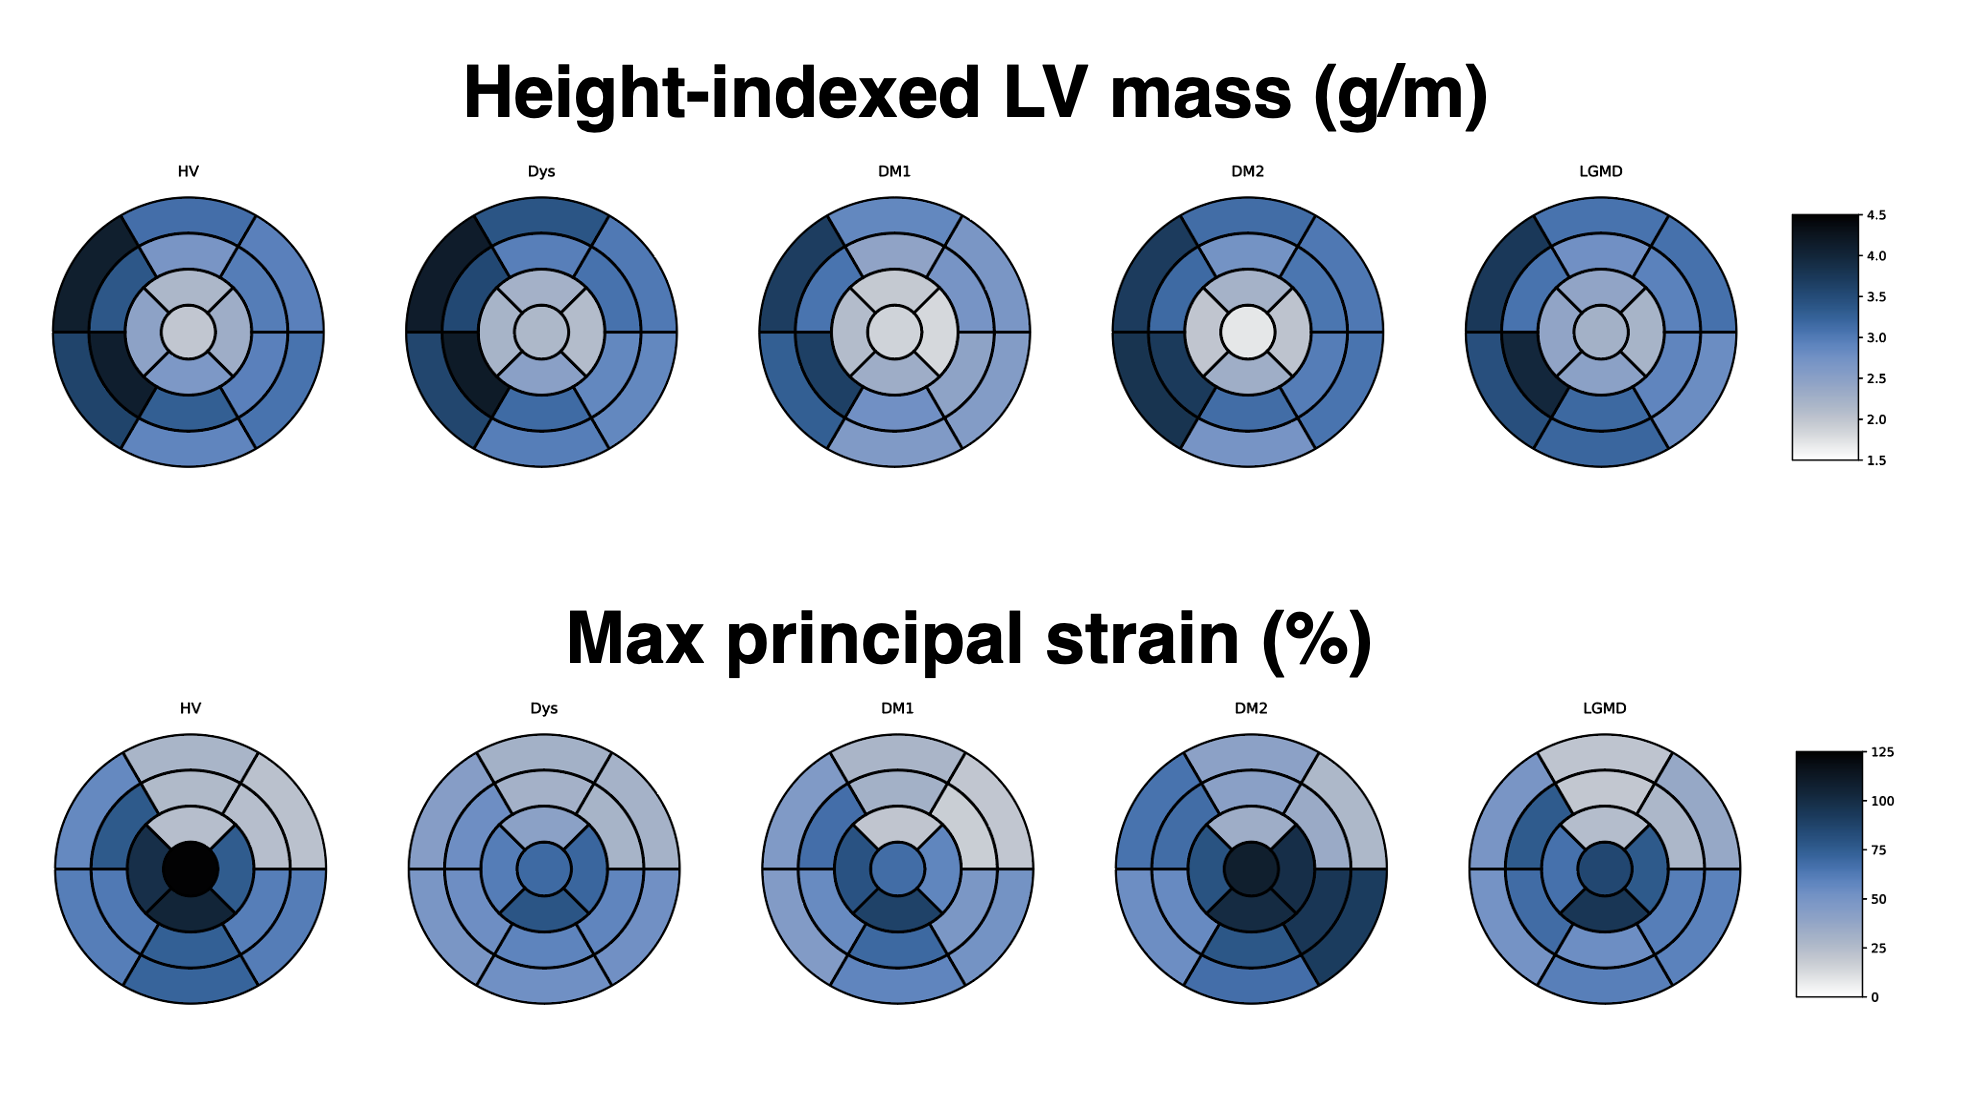 Figure 2. End-diastolic meshes from a representative HV (left panel; 49 Y female) and a patient with Becker muscular dystrophy (right panel; 37 Y male). The patient shows significant left ventricular dilatation, globular shape, and marked reduction in 4Deep LV ejection fraction (21%).