Rapid Fire Session

gilles soulat, MD, PhD
professor of Radiology
Université Paris Cité, INSERM, PARCC, APHP, Hôpital Européen Georges Pompidou
PARIS, Ile-de-France, France
gilles soulat, MD, PhD
professor of Radiology
Université Paris Cité, INSERM, PARCC, APHP, Hôpital Européen Georges Pompidou
PARIS, Ile-de-France, France
adele Magalhaes, MD
Cardiologist
European Hospital Georges Pompidou APHP
PARIS 15, Ile-de-France, France
Bruno Donadille, MD
Endocrinologist
Assistance Publique – Hôpitaux de Paris Hôpital Saint Antoine, Ile-de-France, France
Sophie CHRISTIN-MAITRE, MD, PhD
Professor
Assistance Publique – Hôpitaux de Paris Hôpital Saint Antoine
Paris, France
Laurence Iserin, MD
Assistance Publique Hôpitaux de Paris.Centre, Hôpital Européen Georges Pompidou, F-75015 Paris, France
Paris, Ile-de-France, France
Elie Mousseaux, MD, PhD
Professor
Université Paris Cité, INSERM, PARCC, APHP, Hôpital Européen Georges Pompidou, France
| Turner (n = 95) | controls (n = 95) | p value |
Age at MRI (years) | 37.1 [31.3 – 42.7] | 38.9 [31.8 – 44.9] | 0.230 |
Height (cm) | 157 [153 – 162] | 160 [155 – 163] | 0.101 |
Weight (kg) | 58.0 [51.0 – 67.0] | 62.0 [53.0 – 72.0] | 0.101 |
BMI(kg/m²) | 23.5 [21.4 – 26.8] | 24.3 [20.7 – 29.4] | 0.456 |
BSA (m2) |
| ||
Boyd | 1.61 [1.50 – 1.75] | 1.69 [1.55 – 1.83] | 0.062 |
Haycock | 1.59 [1.49 – 1.73] | 1.67 [1.81 – 1.53] | 0.058 |
Dubois | 1.58 [1.47 – 1.69] | 1.65 [1.53 – 1.75] | 0.034 |
Bicuspid Aortic Valve | 21 [22] | 0 [0] | < 0.001 |
Repaired Aortic coarctation | 5.0 [5.3] | 0 [0] | 0.023 |
Karyotype (n = 85) |
|
|
|
Monosomy 45.X | 21 [25] | – |
|
Mosaicism | 52 [61] | – |
|
Other | 12 [14] | – |
|
Active Smoking | 10 [10.5] | – |
|
Dyslipidemia | 6 [6.3] | – |
|
Diabetes | 5 [5.2] | – |
|
Hypertension | 8 [8.4] | – |
|
Growth Hormone (GH) Treatment | 60 [63] | – |
|
Hormone Replacement Therapy (HRT) | 76 [80] | – |
|
Thyroid Hormone Supplementation | 37 [39] | – |
|
Clinical indication for MRI |
|
|
|
Dilated cardiomyopathy | – | 15 [15.7] |
|
Hypertophic Cardiomyopathy | – | 11 [11.6] |
|
Chest pain | – | 12 [12.6] |
|
Ischemic Heart disease | – | 8 [8.4] |
|
Myocarditis | – | 8 [8.4] |
|
arrhythmias | – | 14 [14.7] |
|
other | – | 27 [28.4] |
|
Measurments Non indexed |
|
|
|
Left ventricular outflow tract (LVOT) (mm) | 21.0 [19.6 – 22.4] | 19.5 [18.0 – 20.7] | < 0.001 |
Aortic annulus (mm) | 21.8 [20.0 – 23.0] | 19.2 [18.0 – 21.2] | < 0.001 |
Average diameter of the sinuses of Valsalva (mm) | 29.7 [27.8 – 32.2] | 27.3 [25.3 – 29.2] | < 0.001 |
Maximum diameter of the sinuses of Valsalva (mm) | 31.0 [28.6 – 33.0] | 28.0 [26.7 – 30.3] | < 0.001 |
Sino-tubular junction (STJ) (mm) | 24.5 [22.2 – 27.3] | 22.7 [21 – 24.5] | < 0.001 |
Mid ascending aorta (mm) | 27.0 [25.0 – 31.0] | 25.7 [23.0 – 28.7] | 0.008 |
Anterior aortic arch (mm) | 22.0 [20.0 – 24.0] | 22.0 [20.0 – 24.3] | 0.297 |
Mid aortic arch (mm) | 19.0 [17.6 – 20.0] | 21.0 [19.0 – 23.0] | < 0.001 |
isthmus | 19.0 [17.0 – 21.0] | 18.6 [17.0 – 21.0] | 0.667 |
Descending aorta (mm) | 19.1 [17.8 – 21.0] | 19.3 [17.5 – 21.0] | 0.823 |
Diaphragmatic aorta (mm) | 18.0 [16.0 – 19.0] | 17 [15.0 – 19.0] | 0.080 |
Measurements Indexed to BSA* |
|
|
|
Maximum diameter of the sinuses of Valsalva (mm/m²) | 18.8 [16.9 – 21.2] | 16.9 [15.7 – 19.0] | < 0.001 |
Mid ascending aorta (mm/m²) | 16.5 [14.7 – 18.2] | 15.3 [13.7 – 17.3] | < 0.001 |
Measurements Indexed to height |
|
|
|
Maximum diameter of the sinuses of Valsalva (mm/m) | 19.5 [17.8 – 21.2] | 17.6 [16.6 – 19.4] | < 0.001 |
Mid ascending aorta (mm/m) | 17.3 [15.5 – 19.3] | 16.5 [14.6 – 17.9] | 0.004 |
Z scores |
|
|
|
Quezada sinuses | 1.06 [0.39 – 1.85] | 0.26 [-0.260 – 1.02] | < 0.001 |
Quezada Mid Ascending | 0.49 [-0.02 – 1.56] | 0.098 [-0.573 – 0.86] | 0.002 |
Roman sinuses | 0.56 [-0.24 – 1.72] | -0.29 [-1.060 – 0.54] | < 0.001 |
Devereux sinus according to BSA | 0.29 [-0.48 – 1.31] | -0.54 [-1.255 – 0.09] | < 0.001 |
Devereux sinus according to height | 0.36 [-0.66 – 1.70] | -0.71 [-1.47 – 0.08] | < 0.001 |
n [%] or median [Q1 – Q3]. * bsa based an Haycock formula |
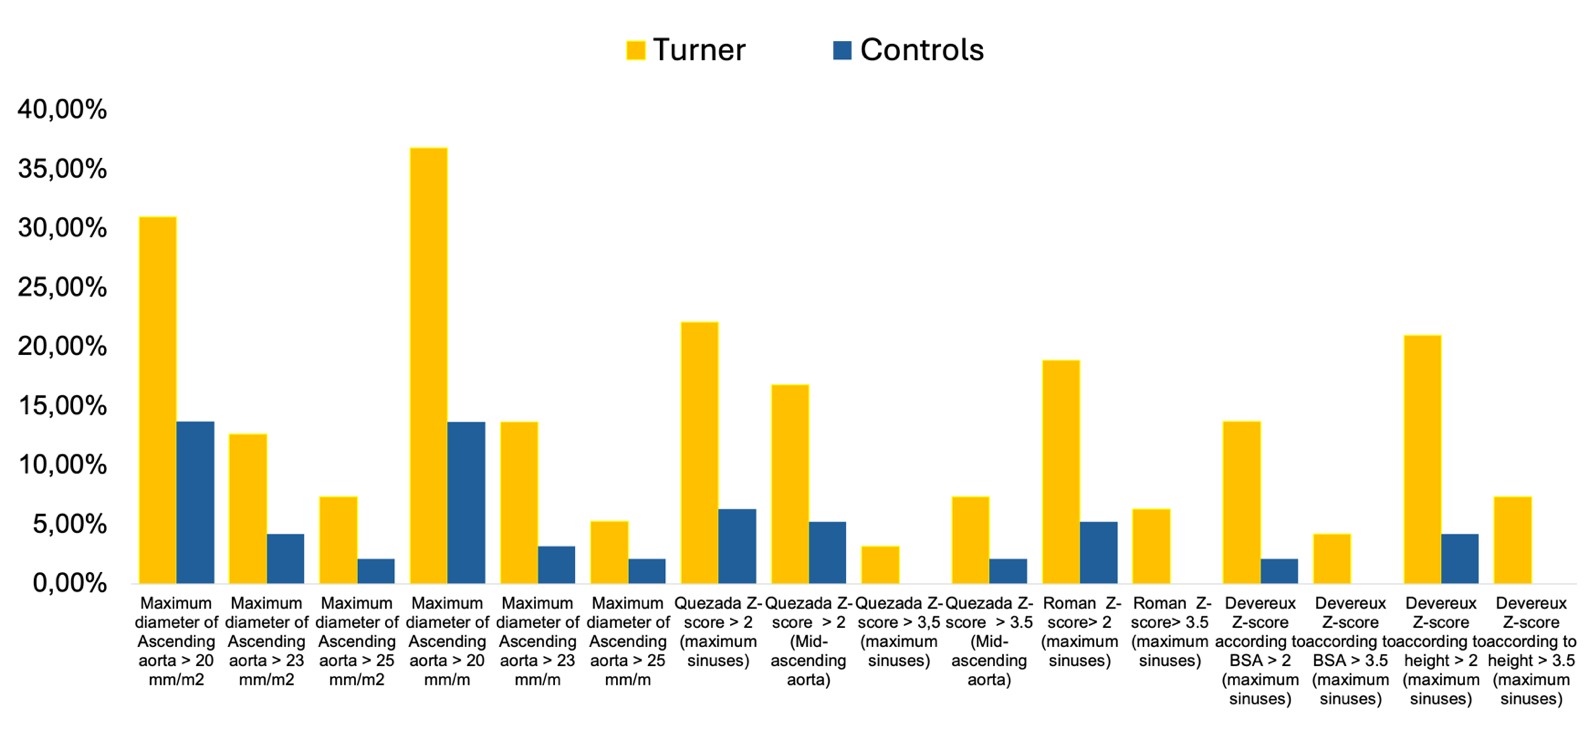
Figure 1: Study Flow chart.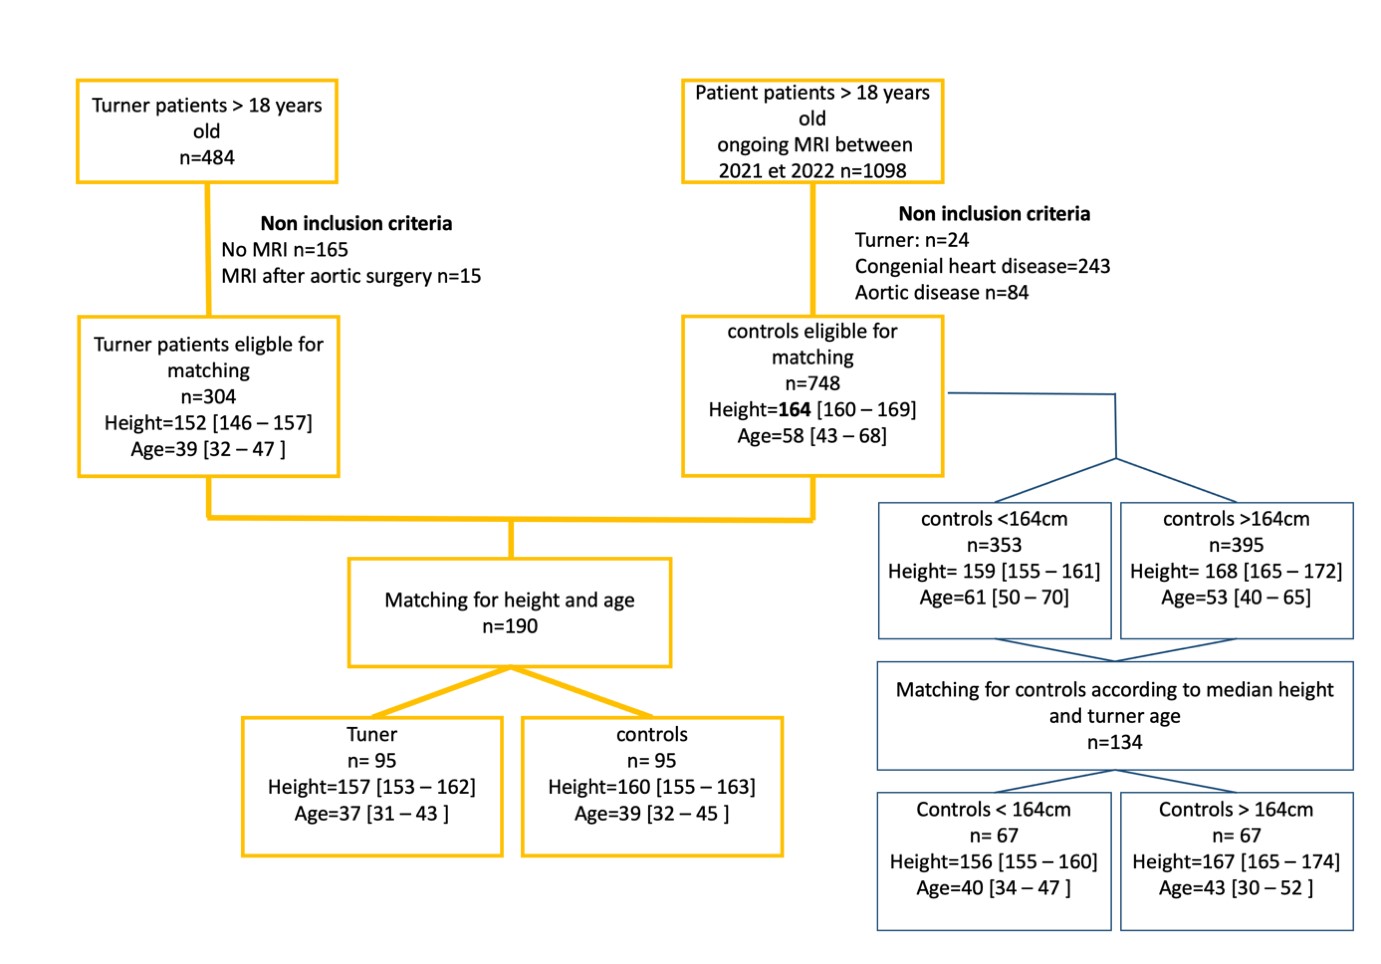 Figure 2: Proportion of turner and controls reaching dilatation and interventions thresholds