
Rapid Fire Session

Khalid Youssef, PhD, MSc
Assistant Professor
Indiana University, Department of Radiology and Imaging Sciences
Indianapolis, Indiana, United States
Khalid Youssef, PhD, MSc
Assistant Professor
Indiana University, Department of Radiology and Imaging Sciences
Indianapolis, Indiana, United States

Rohan Dharmakumar, PhD
Executive Director
Indiana University School of Medicine
Indianapolis, Indiana, United States

KEYUR P. VORA, MD, MSc, FSCMR
Assistant Professor of Medicine
Indiana University School of Medicine
RAJKOT, Gujarat, India
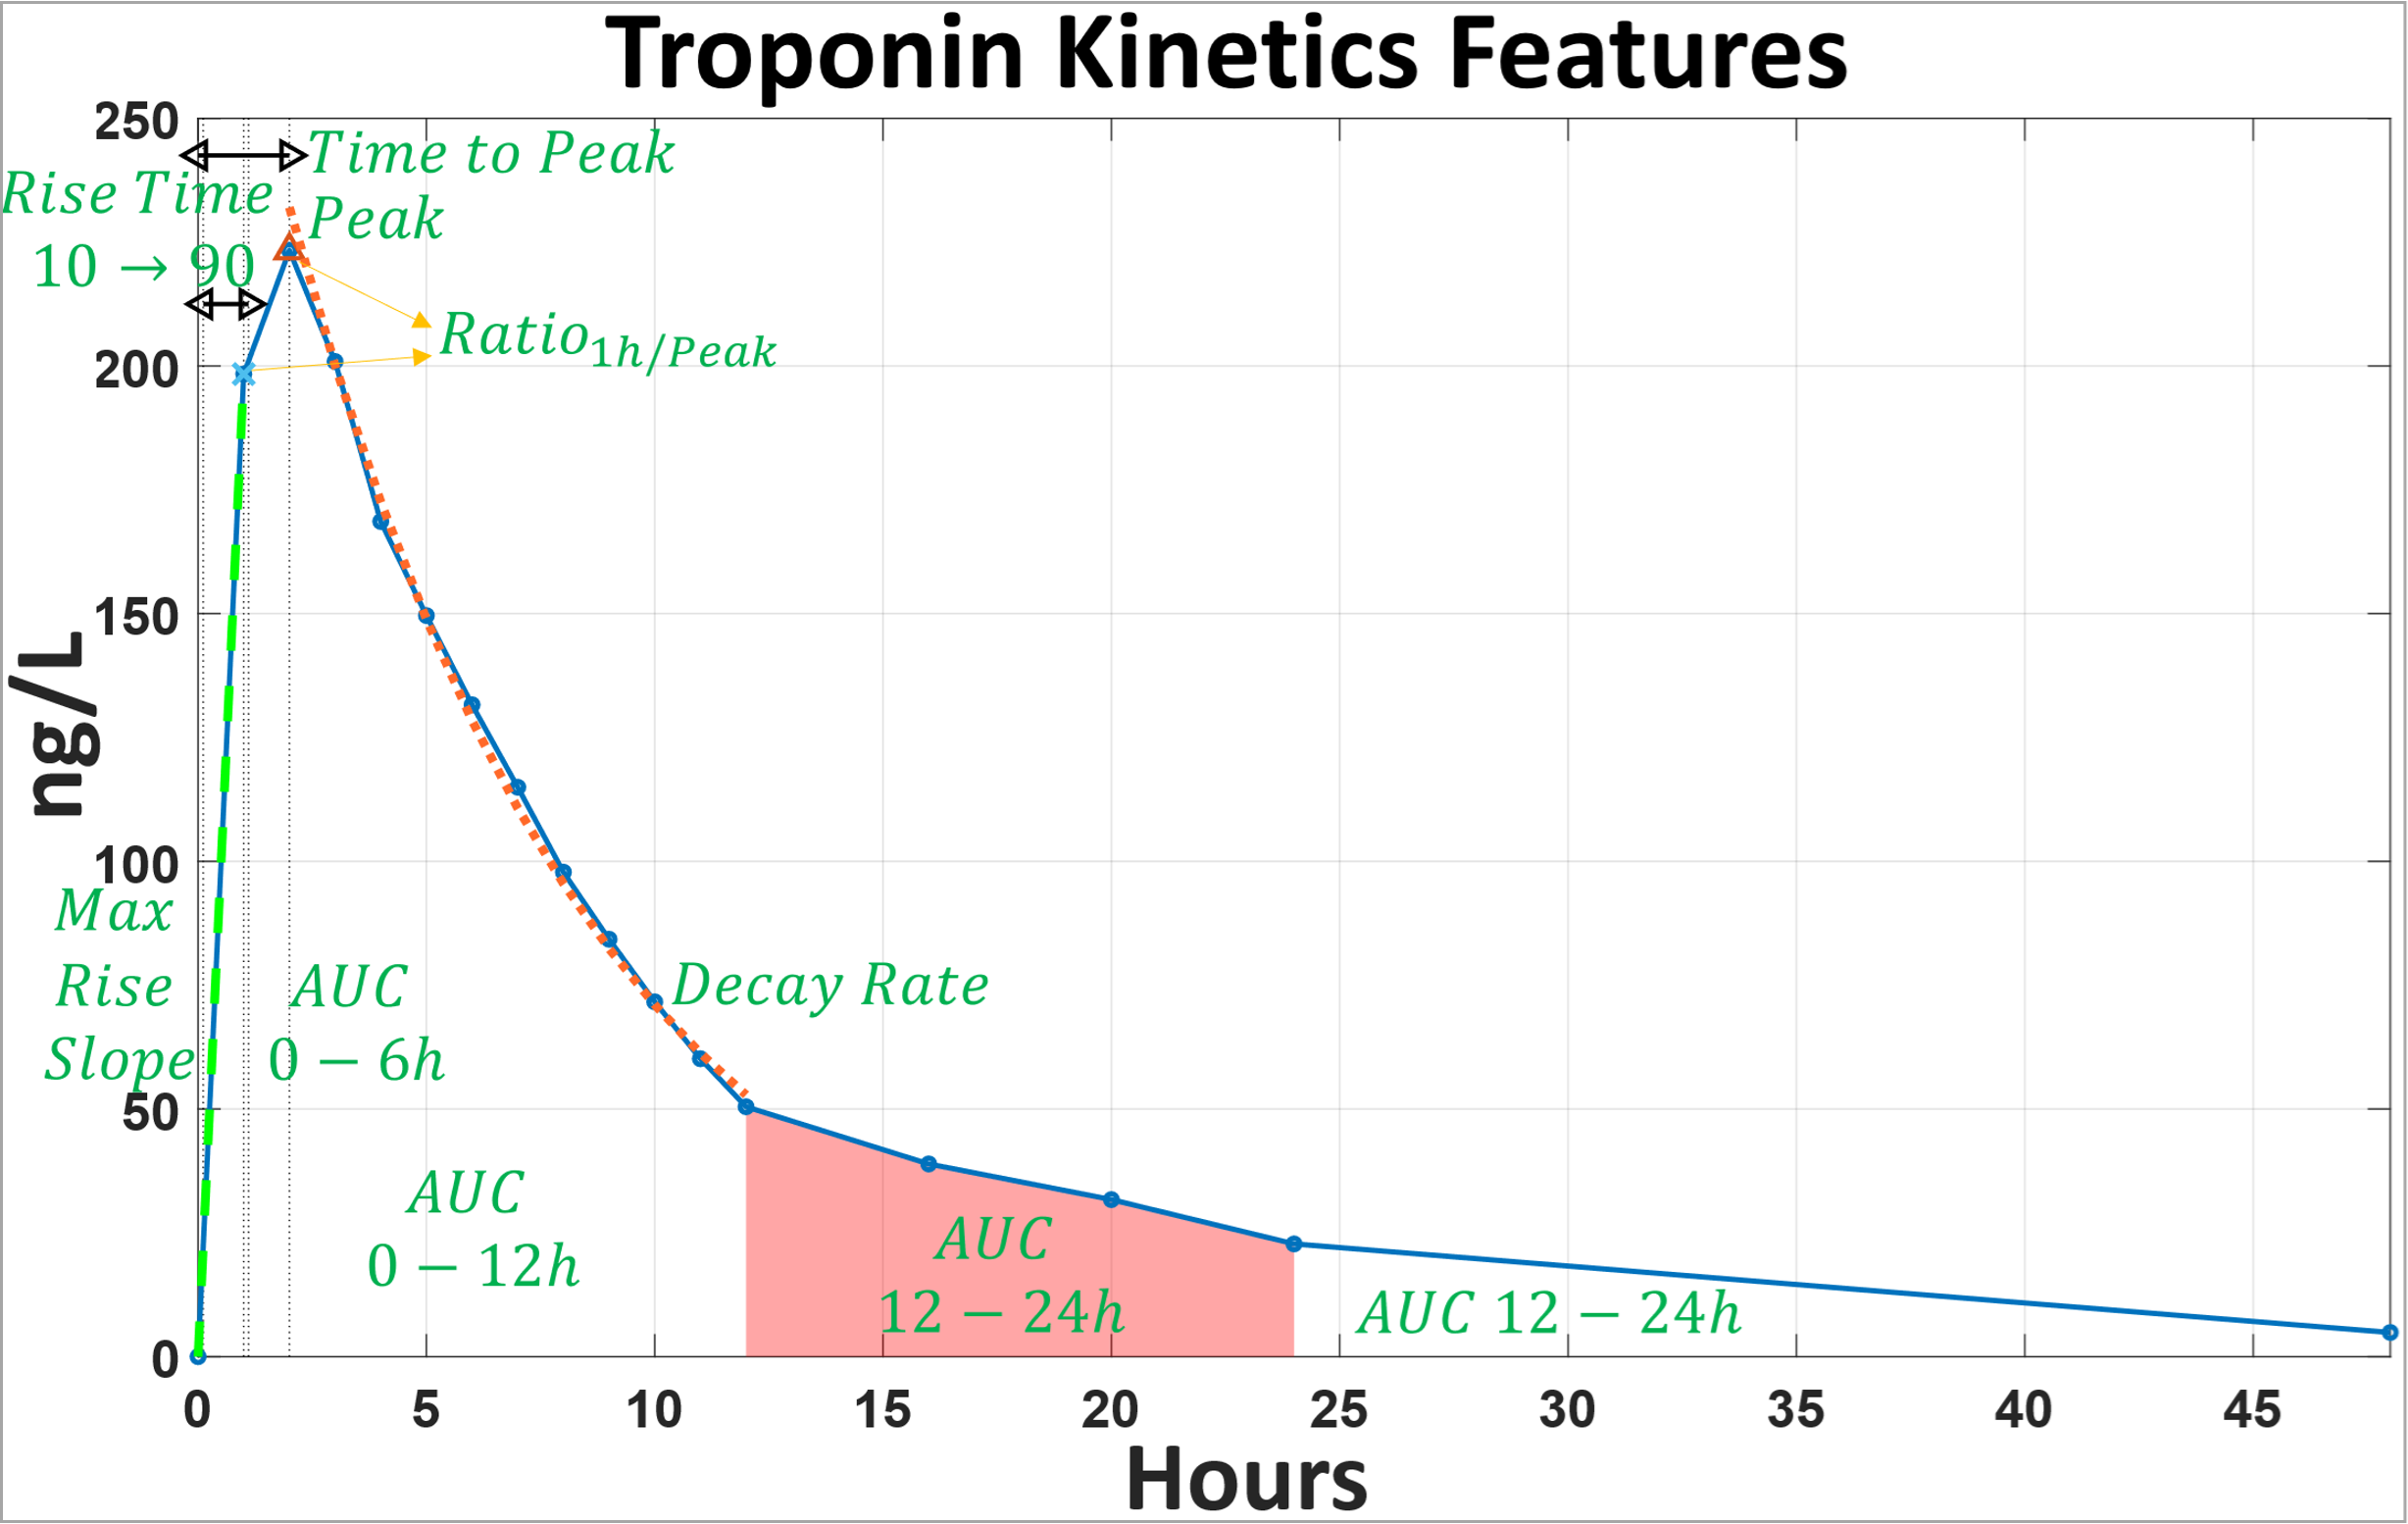 Figure 2. Illustrative examples. This figure shows two illustrative examples of patients with negative (-) and positive (+) IMH post-PCI outcomes. Left Column: Troponin kinetics feature maps. Middle columns: short-axis CMR at 48–72 h—LGE and T2*. Top row (IMH −Ve): no hypointense myocardial region on T2*. Bottom row (IMH +Ve): hypointense region (arrowheads) consistent with intramyocardial hemorrhage (IMH Volume: 11%).
.png) Figure 3. Relationship between troponin kinetics and intra myocardial hemorrhage (IMH) volume. Early troponin exposure is most informative: AUC of 12–24 h (R ≈ 0.62) and AUC of 0–12 h (R ≈ 0.61) show the strongest positive correlations with hemorrhage volume, followed by peak troponin (R≈ 0.57) and the maximum rise slope (R ≈ 0.50). Late exposure (AUC of 24–48 h) has a weaker association (R ≈ 0.19). By contrast, time to peak (R ≈ –0.10), the ratio of the 1 h value to peak (R ≈ –0.04), the log decay rate (R ≈ –0.18) and the 10–90 % rise time (R ≈ –0.10) exhibit weak negative correlations and show non linear trends. The panels collectively highlight that larger IMH volumes are accompanied by higher and more sustained troponin release, whereas timing related metrics change only modestly or in complex ways.
Figure 3. Relationship between troponin kinetics and intra myocardial hemorrhage (IMH) volume. Early troponin exposure is most informative: AUC of 12–24 h (R ≈ 0.62) and AUC of 0–12 h (R ≈ 0.61) show the strongest positive correlations with hemorrhage volume, followed by peak troponin (R≈ 0.57) and the maximum rise slope (R ≈ 0.50). Late exposure (AUC of 24–48 h) has a weaker association (R ≈ 0.19). By contrast, time to peak (R ≈ –0.10), the ratio of the 1 h value to peak (R ≈ –0.04), the log decay rate (R ≈ –0.18) and the 10–90 % rise time (R ≈ –0.10) exhibit weak negative correlations and show non linear trends. The panels collectively highlight that larger IMH volumes are accompanied by higher and more sustained troponin release, whereas timing related metrics change only modestly or in complex ways..png)
