Early Career Award Session
Virtual Recording

Victor de Villedon de Naide, MSc
PhD student
Bordeaux University - INSERM U1045
Bordeaux, Aquitaine, France
Victor de Villedon de Naide, MSc
PhD student
Bordeaux University - INSERM U1045
Bordeaux, Aquitaine, France
Edouard Gerbaud, MD, PhD
Cardiac Intensive Care Unit, Groupe Hospitalier Sud, CHU de Bordeaux, Pessac, France, France
Sane Viola
Engineer
IHU Liryc, Université de Bordeaux, France

Thaïs Genisson, MSc
PhD student
IHU Liryc, Université de Bordeaux
Bordeaux, Aquitaine, France

Kalvin Narceau, MSc
Phd student
Bordeaux University - INSERM U1045
Pessac, Aquitaine, France
Ewan Barel
Engineer
IHU Liryc, Université de Bordeaux, France
Théo Richard, MSc
Engineer
IHU LIRYC, Heart rhythm disease institute, Université de Bordeaux – INSERM U1045, Avenue du Haut Lévêque, 33604, Pessac, France
Bordeaux, Aquitaine, France
Pierre Jaïs, MD, PhD
PROF/PhD
Hôpital Cardiologique du Haut-Lévêque, CHU de Bordeaux
Bordeaux, Aquitaine, France
Matthias Stuber, PhD
Professor/Director
CIBM/CHUV/UNIL
Lausanne, Switzerland
Hubert Cochet, MD, PhD
Professor
Bordeaux University - INSERM U1045
Bordeaux, Aquitaine, France
.jpg "Aurelien Bustin, FSCMR photo")
Aurelien Bustin, FSCMR
Research Associate
Department of Cardiovascular Imaging, Hôpital Cardiologique du Haut-Lévêque, CHU de Bordeaux, Avenue de Magellan, Pessac, France; IHU LIRYC, Electrophysiology and Heart Modeling Institute, Université de Bordeaux – INSERM U1045, Avenue du Haut Lévêque, Pessac, France; Department of Diagnostic and Interventional Radiology, Lausanne University Hospital and University of Lausanne, Lausanne, Switzerland
Bordeaux, Aquitaine, France
| Manual Segmentation | Automated Segmentation | P-value | Bias (95% CI) | Notes |
LV wall volume (mL) | 95.9 ± 29.3 | 92.1 ± 28.1 | 0.737 | -3.8 (-5.8 to -1.8) | - |
LV wall Dice score (%) | N/A | 87.2 ± 1.3 | N/A | N/A | vs. manual ground truth |
Scar volume (mL) | 17.6 ± 20.1 | 10.9 ± 8.5 | 0.285 | -6.7 (-9.6 to -3.7) | - |
Scar burden (% of LV mass) | 31.8 ± 13.1 | 28.7 ± 6.6 | 0.510 | -3.1 (-5.7 to -0.6) | - |
Scar transmurality (%) | 68.0 ± 8.0 | 63.0 ± 7.5 | 0.172 | -5.0 (-7.7 to -2.2) | - |
Scar Dice score (%) | N/A | 68.3 ± 8.2 | N/A | N/A | vs. manual ground truth |
T2 values – segment basis (msec) | 61.9 ± 12.5 | 59.3 ± 12.3 | 0.037 | -2.5 (-2.8 to -2.3) | - |
T2 values – slice basis (msec) | 63.0 ± 11.2 | 60.3 ± 10.5 | 0.076 | -2.7 (-3.1 to -2.4) | - |
T2 values – patient basis (msec) | 63.6 ± 6.4 | 60.8 ± 6.8 | 0.277 | -2.9 (-3.5 to -2.3) | - |
Failure rate scar segmentation (% affected slices) | 0.0% | 30.0% | N/A | N/A | defined as unusable segmentation |
Failure rate LV segmentation (% affected slices) | 0.0% | 5.9% | N/A | N/A | defined as unusable segmentation |
Processing time (min) | >20.0 | < 0.1 | < 0.001 | N/A | - |
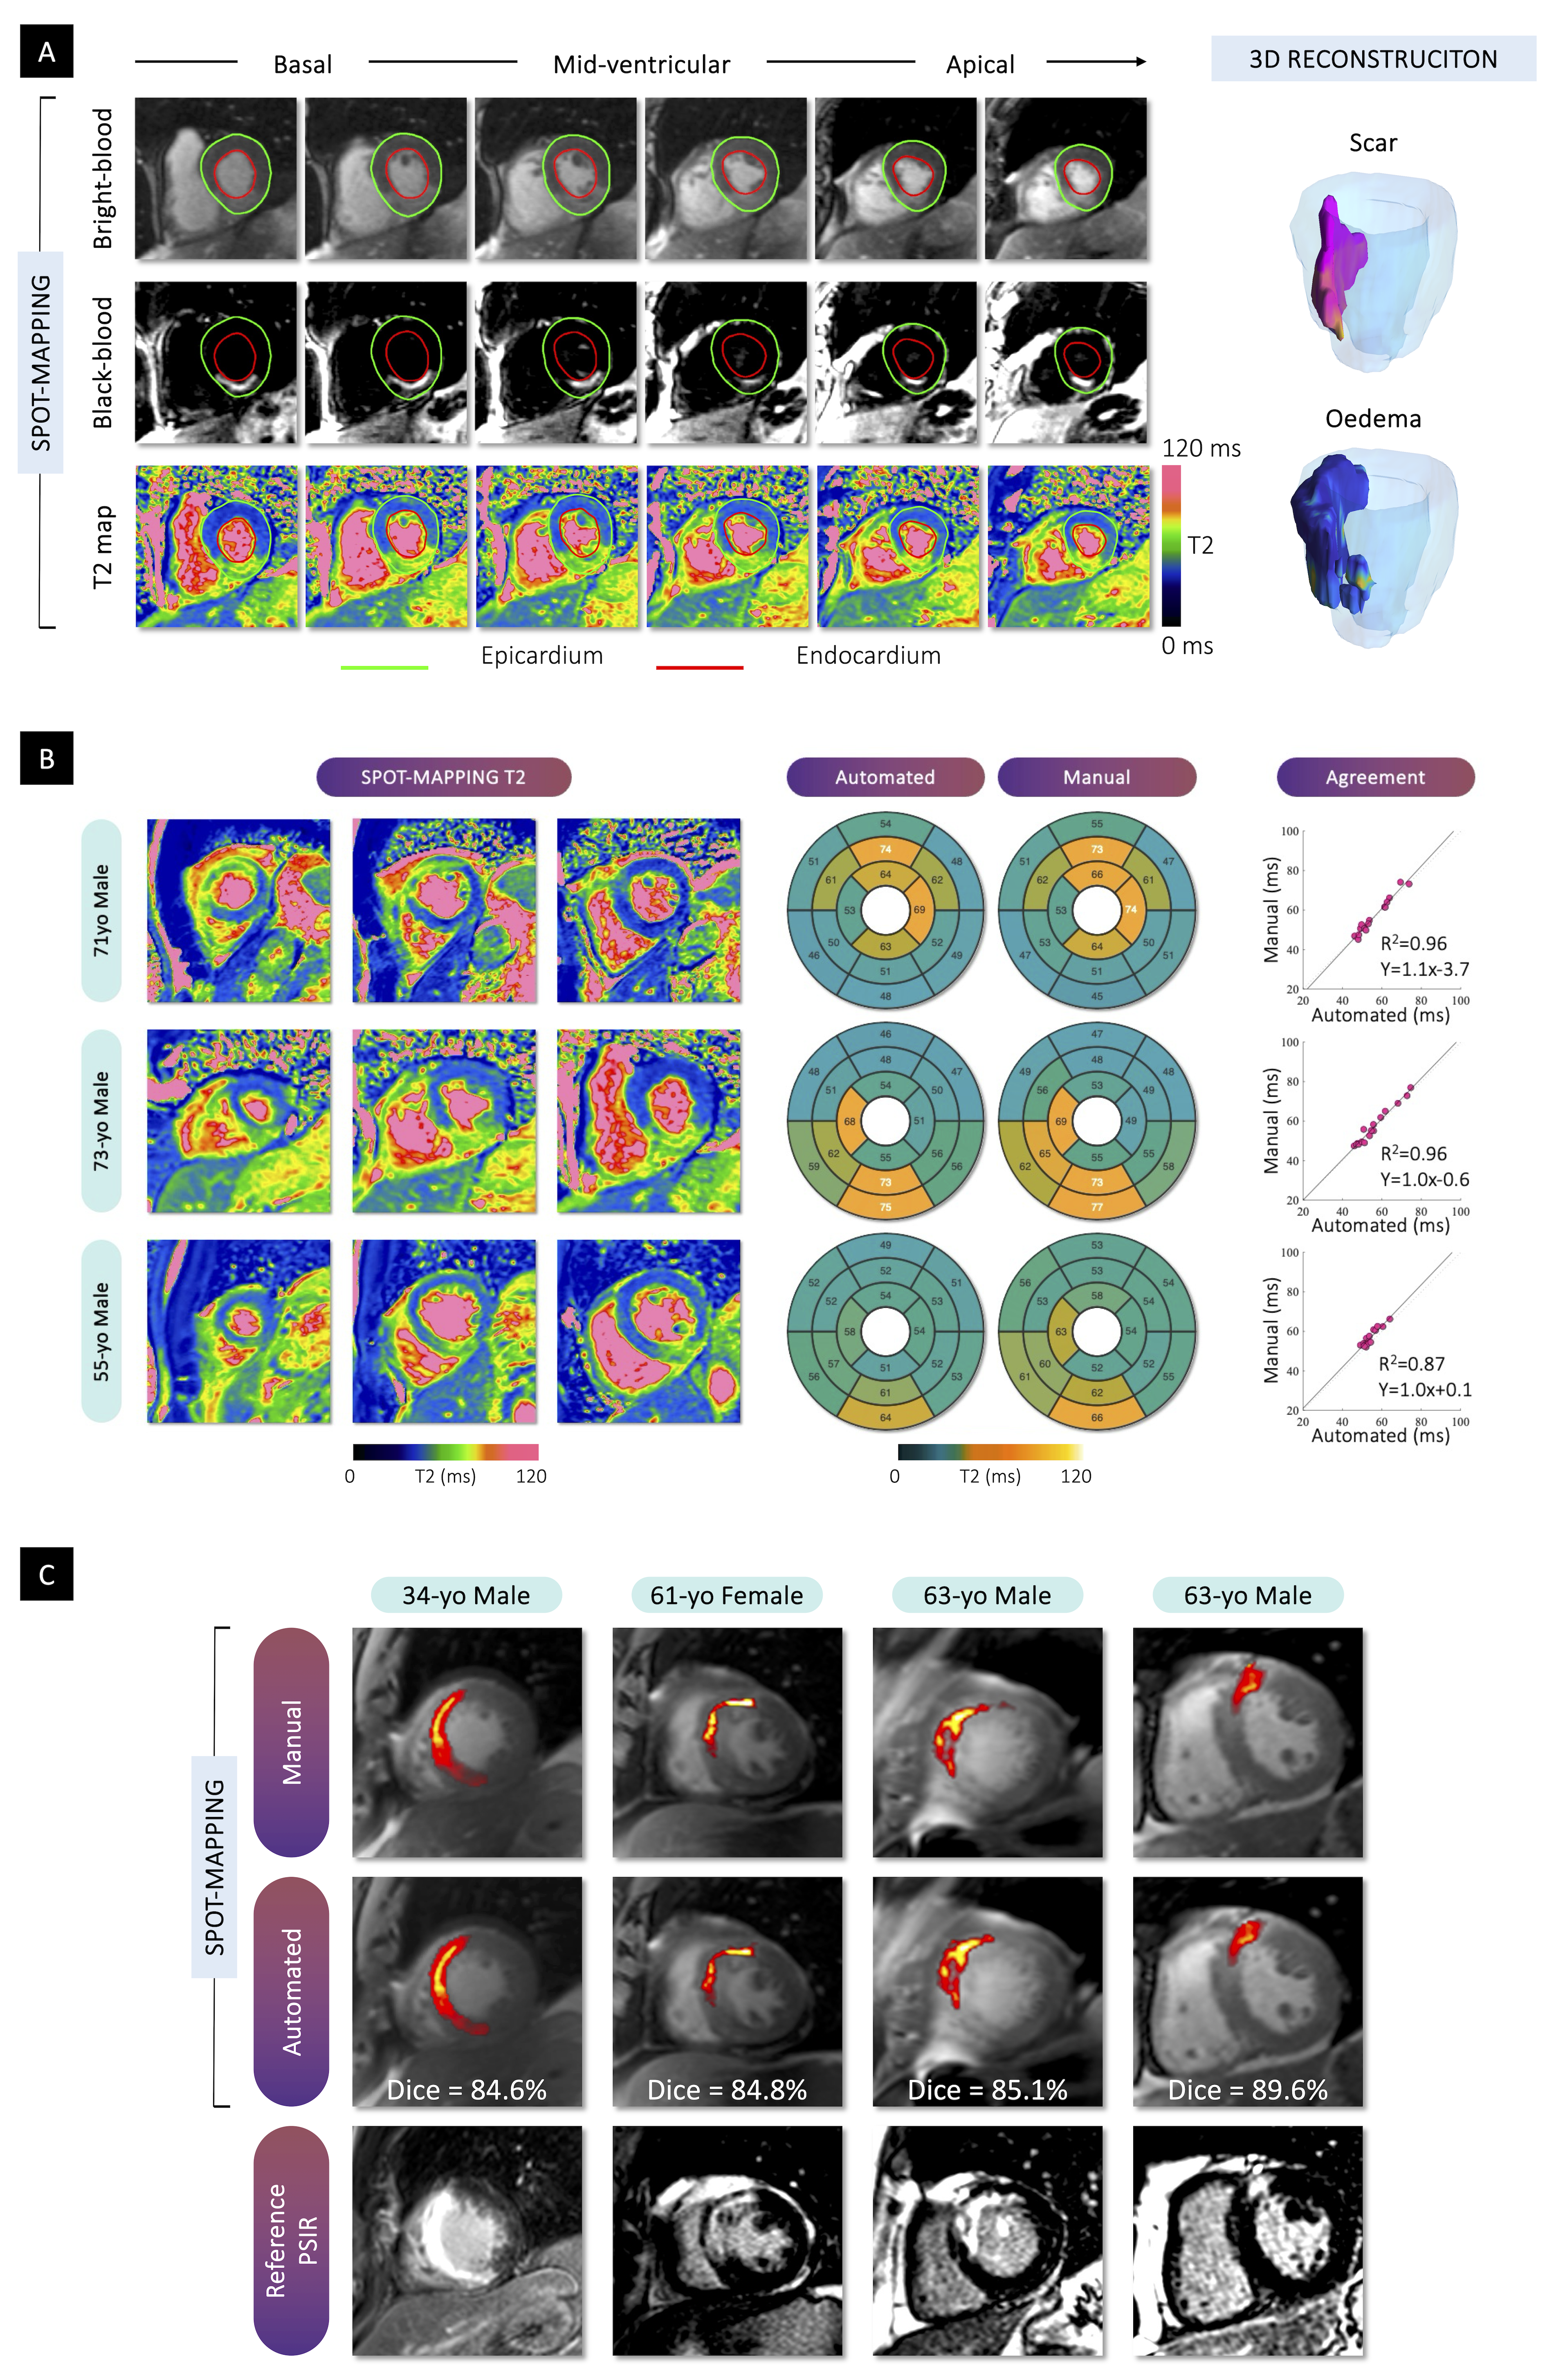
.png) Representative examples of automated versus manual quantification of myocardial scar and oedema using SPOT-MAPPING. A) Representative basal, mid-ventricular, and apical slices from SPOT-MAPPING, including bright-blood, black-blood, and T2 maps, demonstrate regional detection of myocardial oedema and scar, with 3D reconstructions showing spatial distribution. B) Comparison of automated vs. manual segmental T2 quantification in multiple patients, with bullseye plots and scatter plots showing high correlation and agreement across T2 values. C) Scar segmentation overlays from SPOT-MAPPING (manual and automated) compared to PSIR reference images in multiple patients, with Dice coefficients demonstrating strong concordance between automated and manual methods.
Representative examples of automated versus manual quantification of myocardial scar and oedema using SPOT-MAPPING. A) Representative basal, mid-ventricular, and apical slices from SPOT-MAPPING, including bright-blood, black-blood, and T2 maps, demonstrate regional detection of myocardial oedema and scar, with 3D reconstructions showing spatial distribution. B) Comparison of automated vs. manual segmental T2 quantification in multiple patients, with bullseye plots and scatter plots showing high correlation and agreement across T2 values. C) Scar segmentation overlays from SPOT-MAPPING (manual and automated) compared to PSIR reference images in multiple patients, with Dice coefficients demonstrating strong concordance between automated and manual methods.