Rapid Fire Session

KEYUR P. VORA, MD, MSc, FSCMR
Assistant Professor of Medicine
Indiana University School of Medicine
RAJKOT, Gujarat, India
KEYUR P. VORA, MD, MSc, FSCMR
Assistant Professor of Medicine
Indiana University School of Medicine
RAJKOT, Gujarat, India
Andreas Kumar, MD
doctor
Northern Ontario School of Medicine, Sudbury,Ontario, Canada
Sudbury, Ontario, Canada

Rohan Dharmakumar, PhD
Executive Director
Indiana University School of Medicine
Indianapolis, Indiana, United States
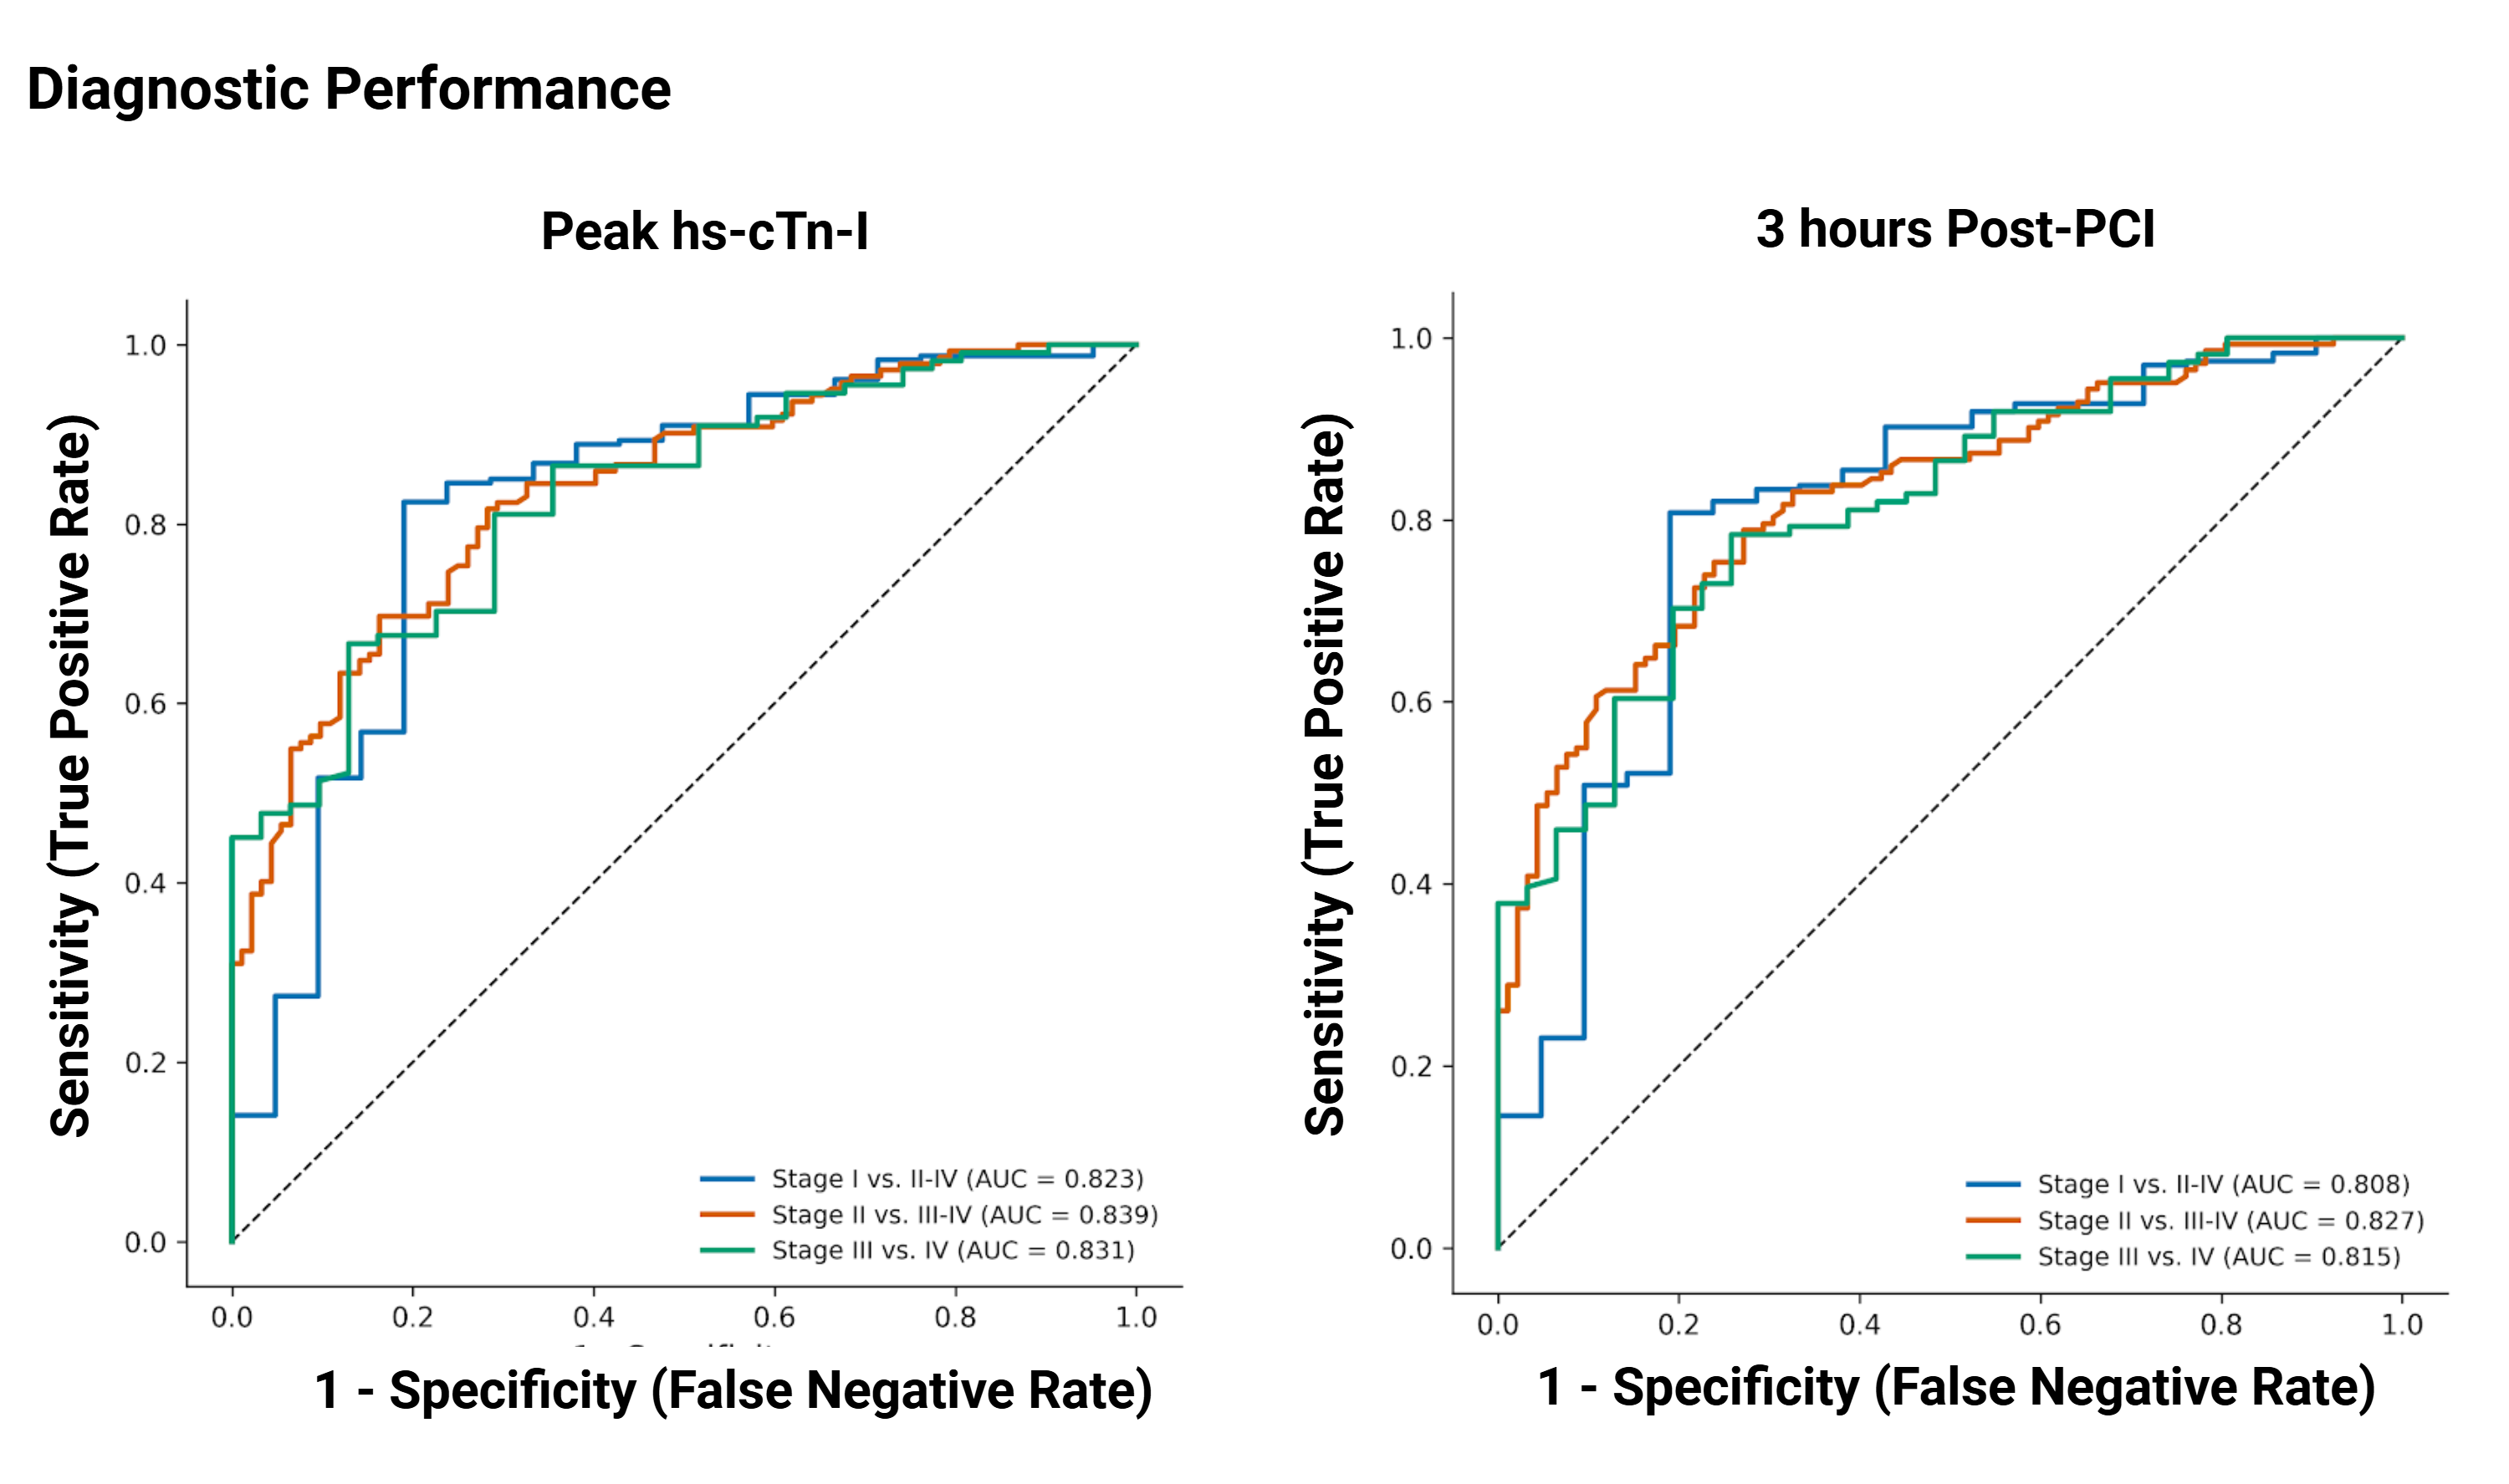
 Figure 2. Blood Marker Based Diagnosis of CCS-AMI Stage of Tissue injury ROC curves demonstrate the discriminatory ability of high-sensitivity cardiac troponin I concentration ([hs-cTn-I]) in differentiating CCS-AMI stages. Left panel shows diagnostic performance at peak [hs-cTn-I], with areas under the curve (AUC) of 0.821 for Stage I vs. Stages II–IV, 0.848 for Stage II vs. Stages III–IV, and 0.887 for Stage III vs. Stage IV. Right Panel shows [hs-cTn-I] measurements at 3 hours post-PCI, yielding AUC values of 0.806, 0.836, and 0.876 for the same stage comparisons, respectively. The high AUC values demonstrate robust diagnostic performance, with earlier post-PCI measurements closely approximating the discriminatory accuracy of peak [hs-cTn-I] values.