
Early Career Award Session
Virtual Recording

Simon J. Littlewood, MD
Clinical Research Fellow
King's College London
London, England, United Kingdom
Simon J. Littlewood, MD
Clinical Research Fellow
King's College London
London, England, United Kingdom
Natalie Montarello, MD
Consultant Cardiologist
Guy's and St Thomas' NHS Foundation Trust, United Kingdom

Reza Hajhosseiny, MD, PhD
Consultant Cardiologist
King's College London
London, England, United Kingdom
Michael G. Crabb, PhD
Research Associate
King's College London
London, England, United Kingdom
Dongyue Si, PhD
Research Associate
King's College London
London, England, United Kingdom
.jpg "Karl P. Kunze, PhD photo")
Karl P. Kunze, PhD
Senior Cardiac MR Scientist
Siemens Healthineers
Camberley, England, United Kingdom

Claudia Prieto, PhD
Professor
Pontificia Universidad Católica de Chile / King's College London
Santiago, Region Metropolitana, Chile

Rene M. Botnar
Professor of Cardiovascular Imaging
Institute for Biological and Medical Engineering, Pontificia Universidad Católica de Chile
Santiago de Chile, Region Metropolitana, Chile
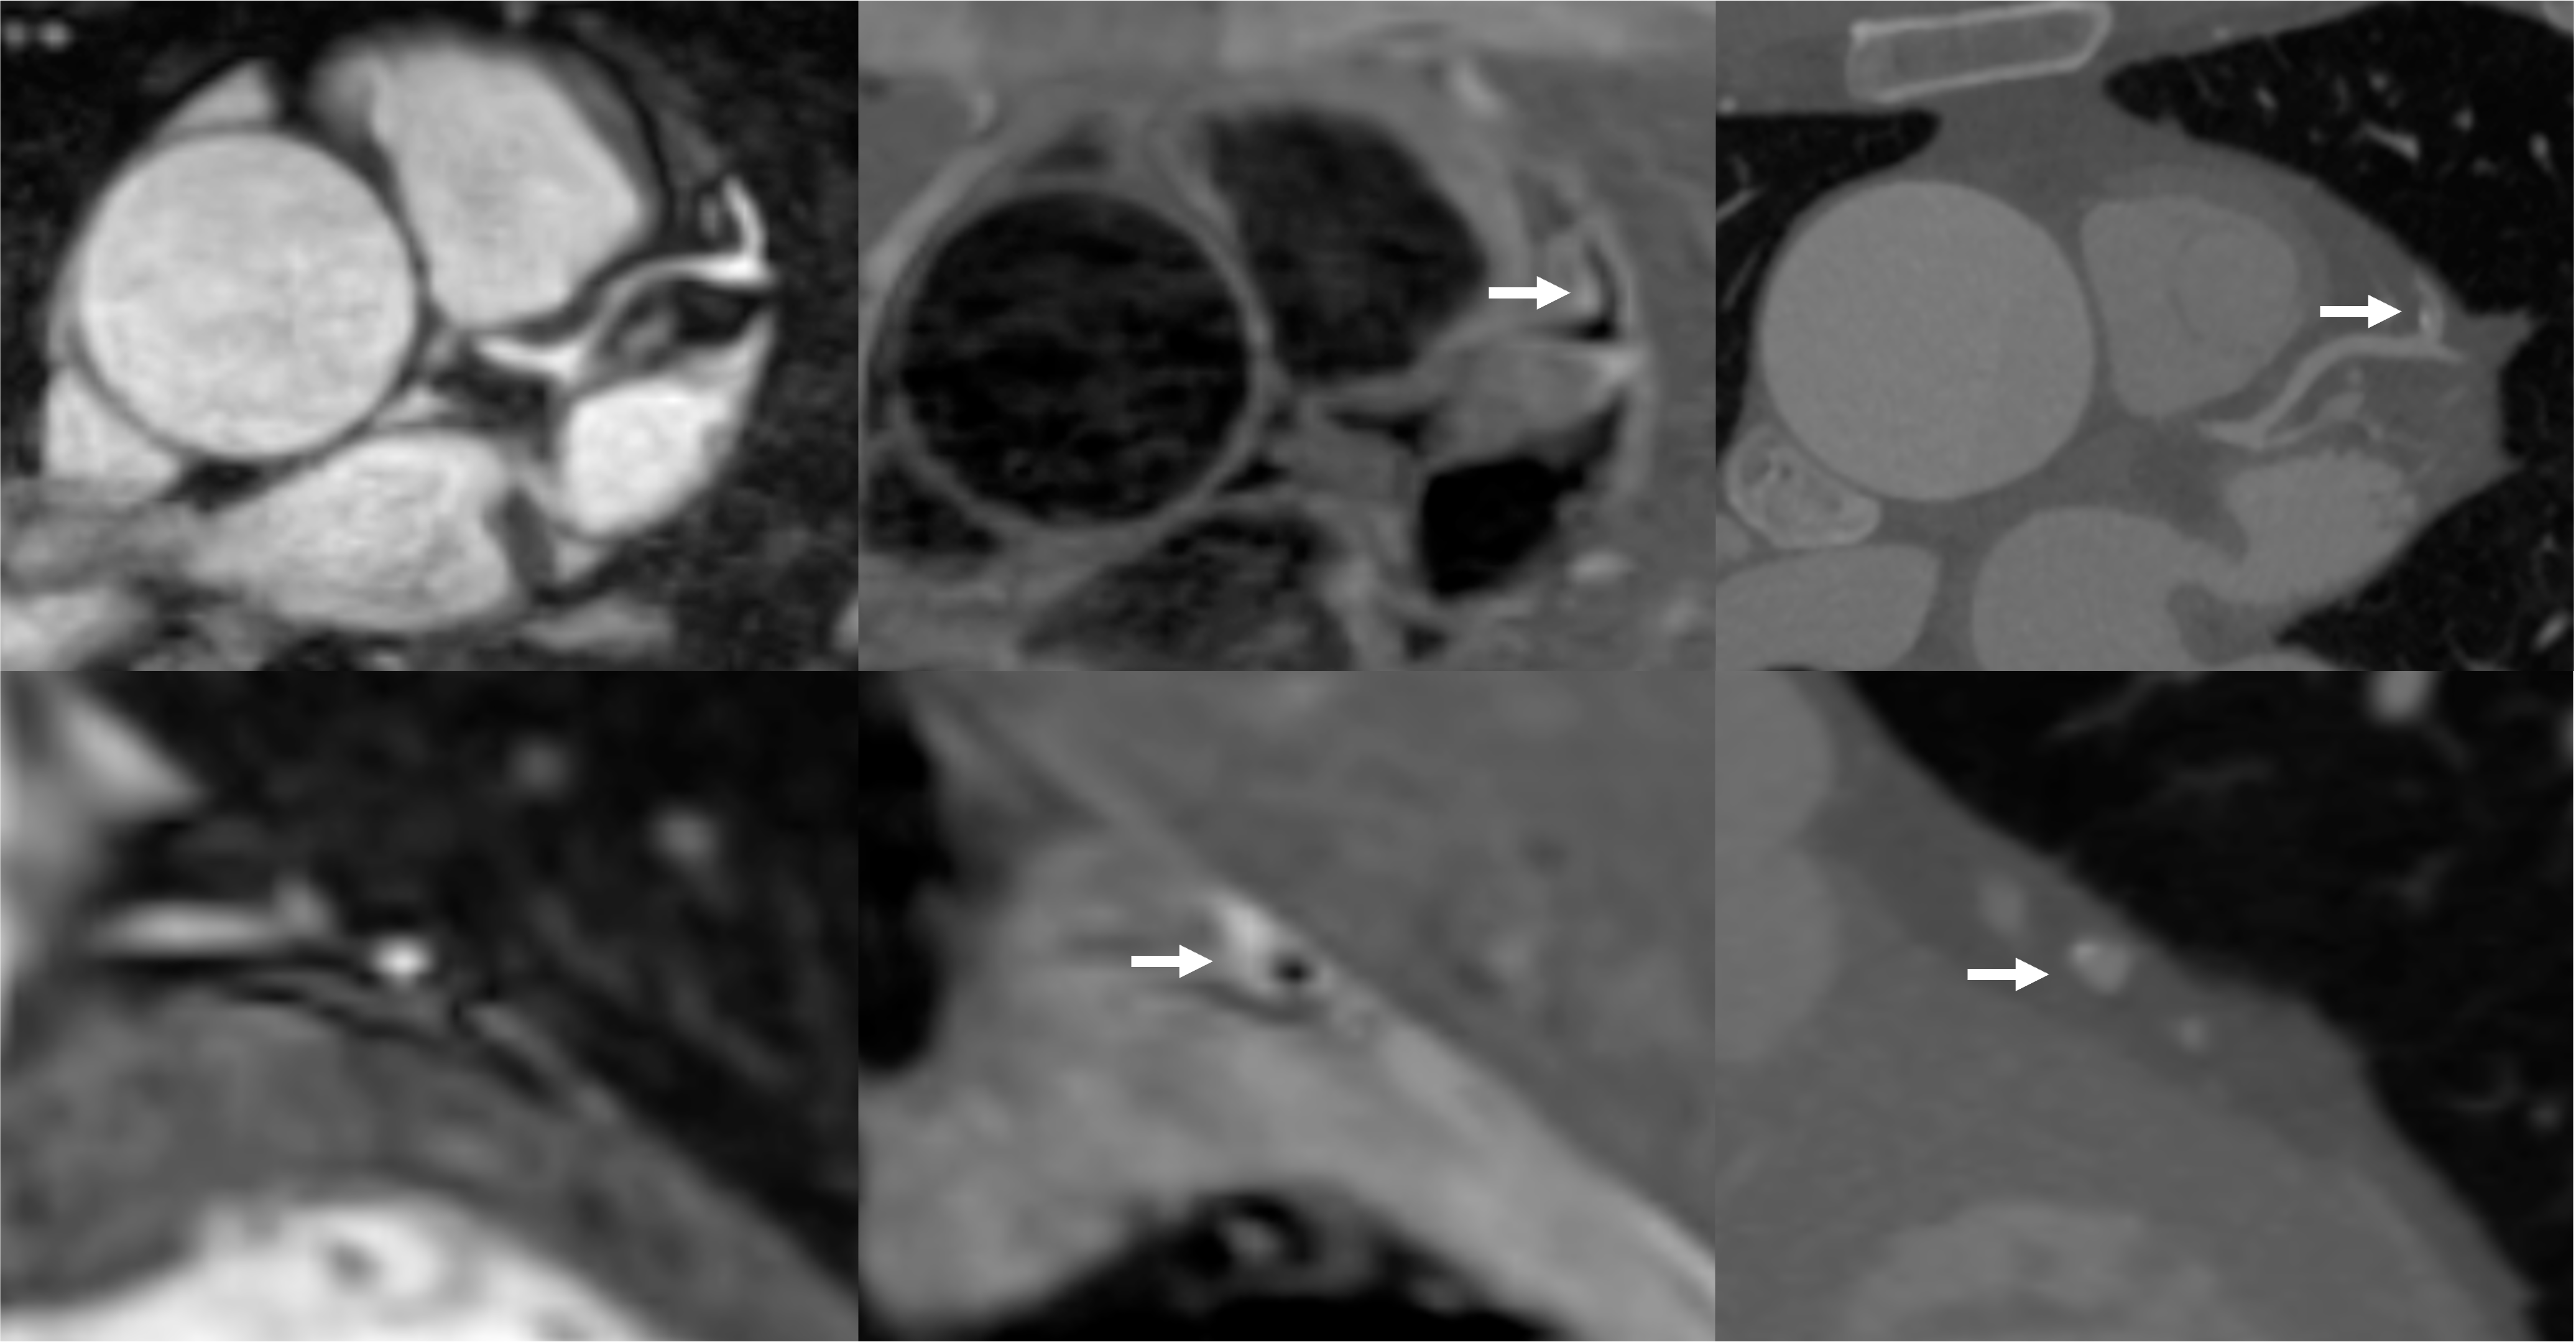 Figure 2. Plaque visualisation in the proximal RCA using iT2prep-BOOST and CTCA. Top left: BOOST bright-blood image; Top right: BOOST black-blood image; Bottom left: fusion image of bright- and black-blood BOOST; Bottom right: corresponding CTCA image. White arrows indicate the location of an atherosclerotic plaque in the proximal RCA, which appears hyperintense on the black-blood image and corresponds to a partially calcified lesion on CTCA.
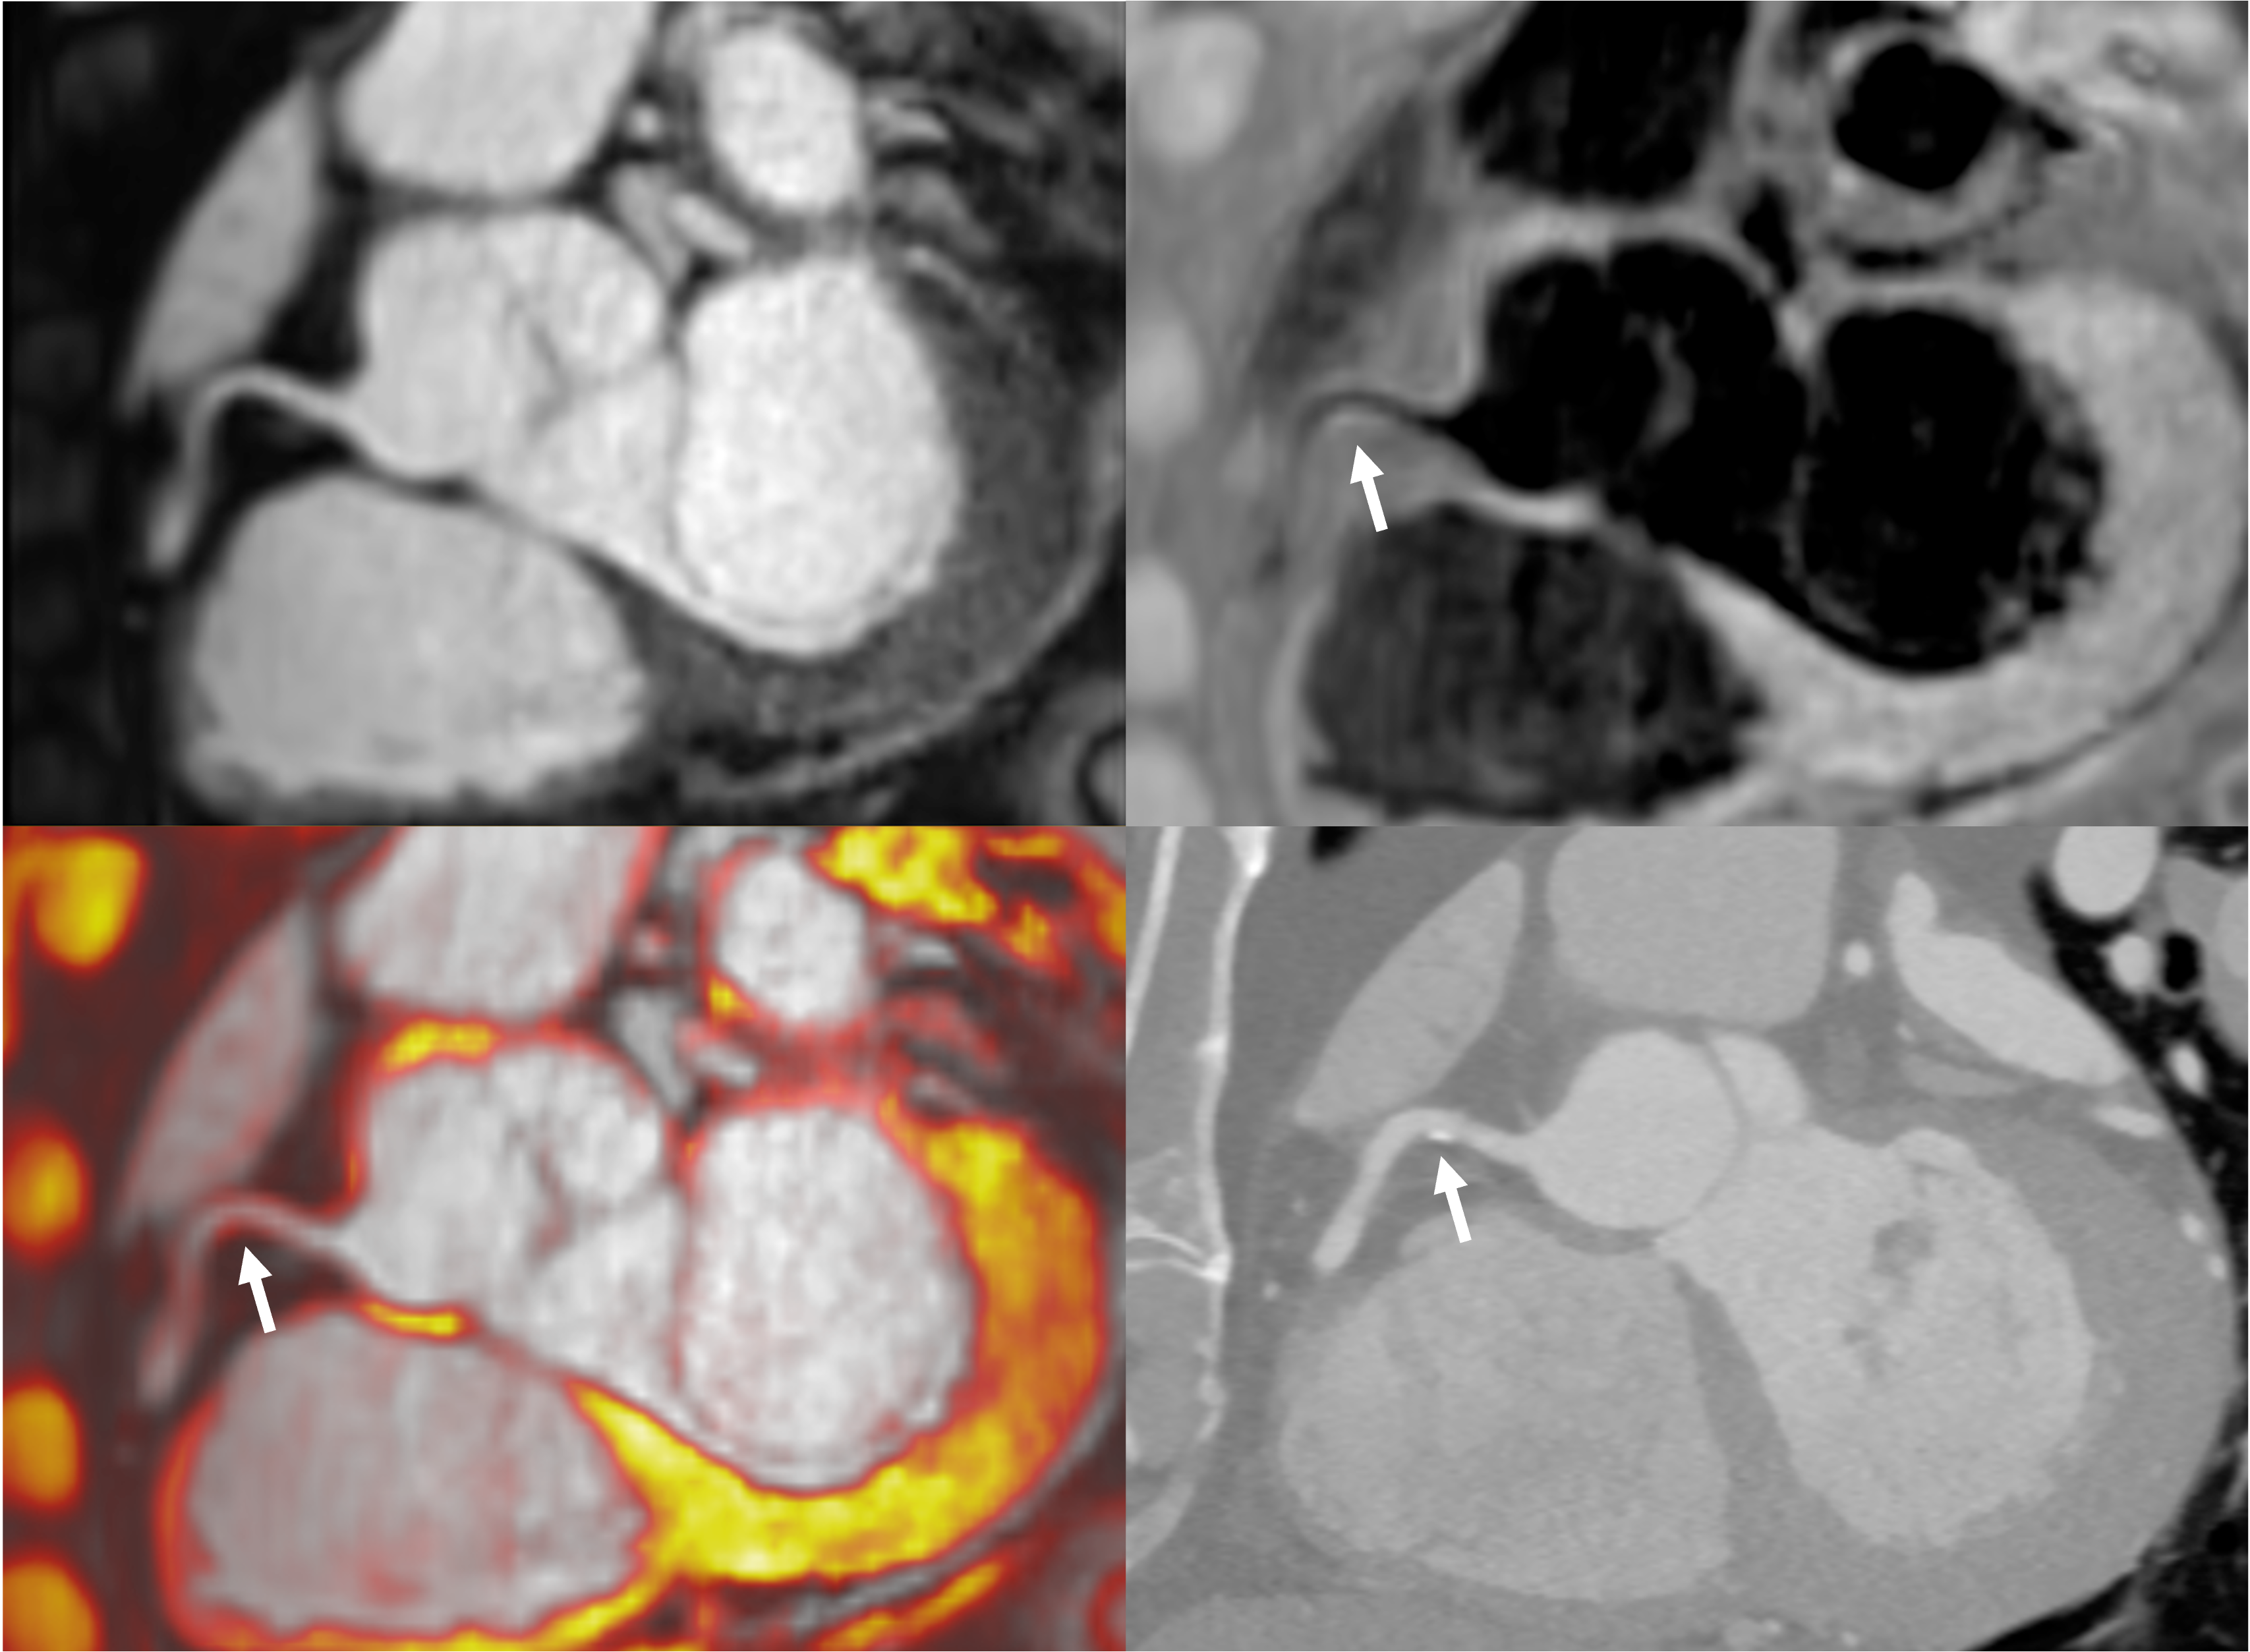 Figure 3. Paired comparison of PMR and healthy HVMR on iT2prep-BOOST (left) and Subgroup analysis of PMR across plaque morphologies and healthy vessels (right). Each red dot represents a single coronary plaque, with lines connecting paired PMR and HVMR values from the same patient. PMR values were significantly higher than HVMR values (mean difference = 0.28, p < 0.001), indicating increased signal in plaque regions relative to healthy vessel segments. Individual PMR values are shown for healthy vessels (blue), calcified plaques (red), mixed plaques (orange), and non-calcified plaques (green). A one-way ANOVA demonstrated a significant difference among groups (p < 0.001). Tukey’s post hoc test showed significantly higher PMR higher in all plaque types compared to healthy vessels (healthy vs calcified: mean difference –0.17, 95% CI –0.254= to –0.09, p < 0.001; healthy vs mixed: –0.35, 95% CI –0.42 to –0.27, p < 0.001; healthy vs non-calcified: –0.33, 95% CI –0.42 to –0.24, p < 0.001). Both mixed and non-calcified plaques showed significantly higher PMR than calcified plaques (mean difference –0.17, 95% CI –0.27 to –0.08, p < 0.001 and mean difference –0.16, 95% CI –0.26 to –0.05, p < 0.001, respectively). No significant difference was observed between mixed and non-calcified plaques (mean difference 0.02, 95% CI –0.09 to 0.12, p = 0.98).
.png)
