Oral Abstracts Session

Alexander Schulz, MD
Dr.
Harvard Medical School / BIDMC
Berlin, Berlin, Germany
Alexander Schulz, MD
Dr.
Harvard Medical School / BIDMC
Berlin, Berlin, Germany
Lily Peng
Research Assistant
Harvard Medical School, Massachusetts, United States

Amine Amyar, PhD
Instructor in medicine
Harvard Medical School - Beth Israel Deaconess Medical Center
Boston, Massachusetts, United States

Warren J. Manning, MD
Professor
Harvard Medical School
Boston, Massachusetts, United States
Ethan Rowin
Doctor
Lahey Hospital, United States
Martin S Maron, MD
Cardiologist
beth israel lahey health, Massachusetts, United States
Reza Nezafat, PhD
Professor
Harvard Medical School
Boston, Massachusetts, United States
Total (n=1449) | Development Set (n=1014) | Test Set (n=435) | p-value (Development vs Test) | |
Male Sex | 957 (66%) | 680 (67%) | 277 (64%) | 0.236 |
Age at index visit (years) | 48 ± 18 | 47 ± 18 | 49 ± 17 | 0.056 |
BMI (kg/m²) | 29 ± 6 | 29 ± 6 | 27 ± 6 | 0.693 |
Arterial hypertension | 401 (28%) | 282 (28%) | 119 (27%) | 0.898 |
Hyperlipoproteinaemia | 353 (24%) | 232 (23%) | 121 (28%) | 0.204 |
Diabetes mellitus | 78 (5%) | 43 (4%) | 35 (8%) | 0.030 |
Coronary artery disease | 61 (4%) | 38 (4%) | 23 (5%) | 0.107 |
Prior Myocardial Infarction | 15 (1%) | 9 (1%) | 6 (1%) | 0.765 |
Prior Stroke | 16 (1%) | 8 (1%) | 8 (2%) | 0.300 |
ICD | 11 (1%) | 8 (1%) | 3 (1%) | 0.902 |
NYHA Class II | 588 (41%) | 401 (40%) | 187 (43%) | 0.244 |
Syncope | 104 (7%) | 77 (8%) | 27 (6%) | 0.409 |
Family history of HCM | 386 (27%) | 268 (26%) | 118 (27%) | 0.916 |
Positive record of genetic mutation | 141 (10%) | 92 (9%) | 49 (11%) | 0.233 |
Resting gradient ≥30mmHg | 290 (20%) | 197 (19%) | 93 (21%) | 0.436 |
Peak LVOT Gradient |
|
|
|
|
≤30 mmHg | 806 (56%) | 574 (57%) | 232 (53%) | 0.275 |
30-49 mmHg | 119 (8%) | 83 (8%) | 36 (8%) | 1.000 |
50-85 mmHg | 290 (20%) | 202 (20%) | 88 (20%) | 0.950 |
>85 mmHg | 234 (16%) | 155 (15%) | 79 (18%) | 0.199 |
Medication |
|
|
|
|
Beta blocker | 694 (48%) | 478 (47%) | 216 (50%) | 0.412 |
Calcium Channel Blockers | 216 (15%) | 145 (14%) | 71 (16%) | 0.363 |
Disopyramide | 35 (2%) | 27 (3%) | 8 (2%) | 0.454 |
Amiodarone | 7 (0%) | 5 (0%) | 2 (0%) | 1.000 |
ACE inhibitor / ARB | 283 (20%) | 194 (19%) | 89 (20%) | 0.609 |
Diuretics | 135 (9%) | 86 (8%) | 49 (11%) | 0.116 |
CMR |
|
|
|
|
Apical Aneurysm | 50 (3%) | 30 (3%) | 20 (5%) | 0.159 |
Maximum WT (mm) | 18 ± 5 | 18 ± 5 | 18 ± 5 | 0.951 |
LV MI (g/m2) | 74 ± 27 | 75 ± 27 | 73 ± 27 | 0.195 |
LV EDVI (ml/m2) | 77 ± 17 | 77 ± 17 | 77 ± 16 | 0.932 |
LV ESVI (ml/m2) | 26 ± 9 | 26 ± 9 | 26 ± 8 | 0.888 |
LV SVI (ml/m2) | 51 ± 11 | 51 ± 11 | 51 ± 12 | 0.896 |
LVEF (%) | 66 ± 7 | 66 ± 7 | 66 ± 7 | 0.832 |
LA diameter (mm) | 39 ± 9 | 39 ± 9 | 39 ± 9 | 0.230 |
LA diameter ≥45mm | 340 (23%) | 231 (23%) | 109 (25%) | 0.385 |
RV EDVI (ml/m2) | 68 ± 18 | 68 ± 19 | 69 ± 18 | 0.535 |
RV ESVI (ml/m2) | 28 ± 11 | 29 ± 11 | 28 ± 10 | 0.970 |
RV SVI (ml/m2) | 40 ± 11 | 40 ± 11 | 40 ± 11 | 0.434 |
RV EF (%) | 59 ± 8 | 59 ± 9 | 59 ± 8 | 0.240 |
LGE presence | 734 (51%) | 514 (51%) | 220 (51%) | 0.993 |
Absolute LGE mass (g) | 5 ± 11 | 5 ± 11 | 5 ± 11 | 0.982 |
Relative LGE mass (%) | 3 ± 6 | 3 ± 5 | 3 ± 6 | 0.965 |
LGE > 15% | 59 (4%) | 40 (4%) | 19 (4%) | 0.985 |
Outcome |
|
|
|
|
Follow-up Time (years) | 4.6 ± 3.0 | 4.6 ± 3.0 | 4.6 ± 3.0 | 0.687 |
Heart failure | 231 (16%) | 162 (16%) | 69 (16%) | 1.000 |
New onset atrial fibrillation | 117 (8%) | 81 (8%) | 35 (8%) | 1.000 |
Sudden cardiac death | 41 (3%) | 34 (3%) | 7 (2%) | 0.097 |
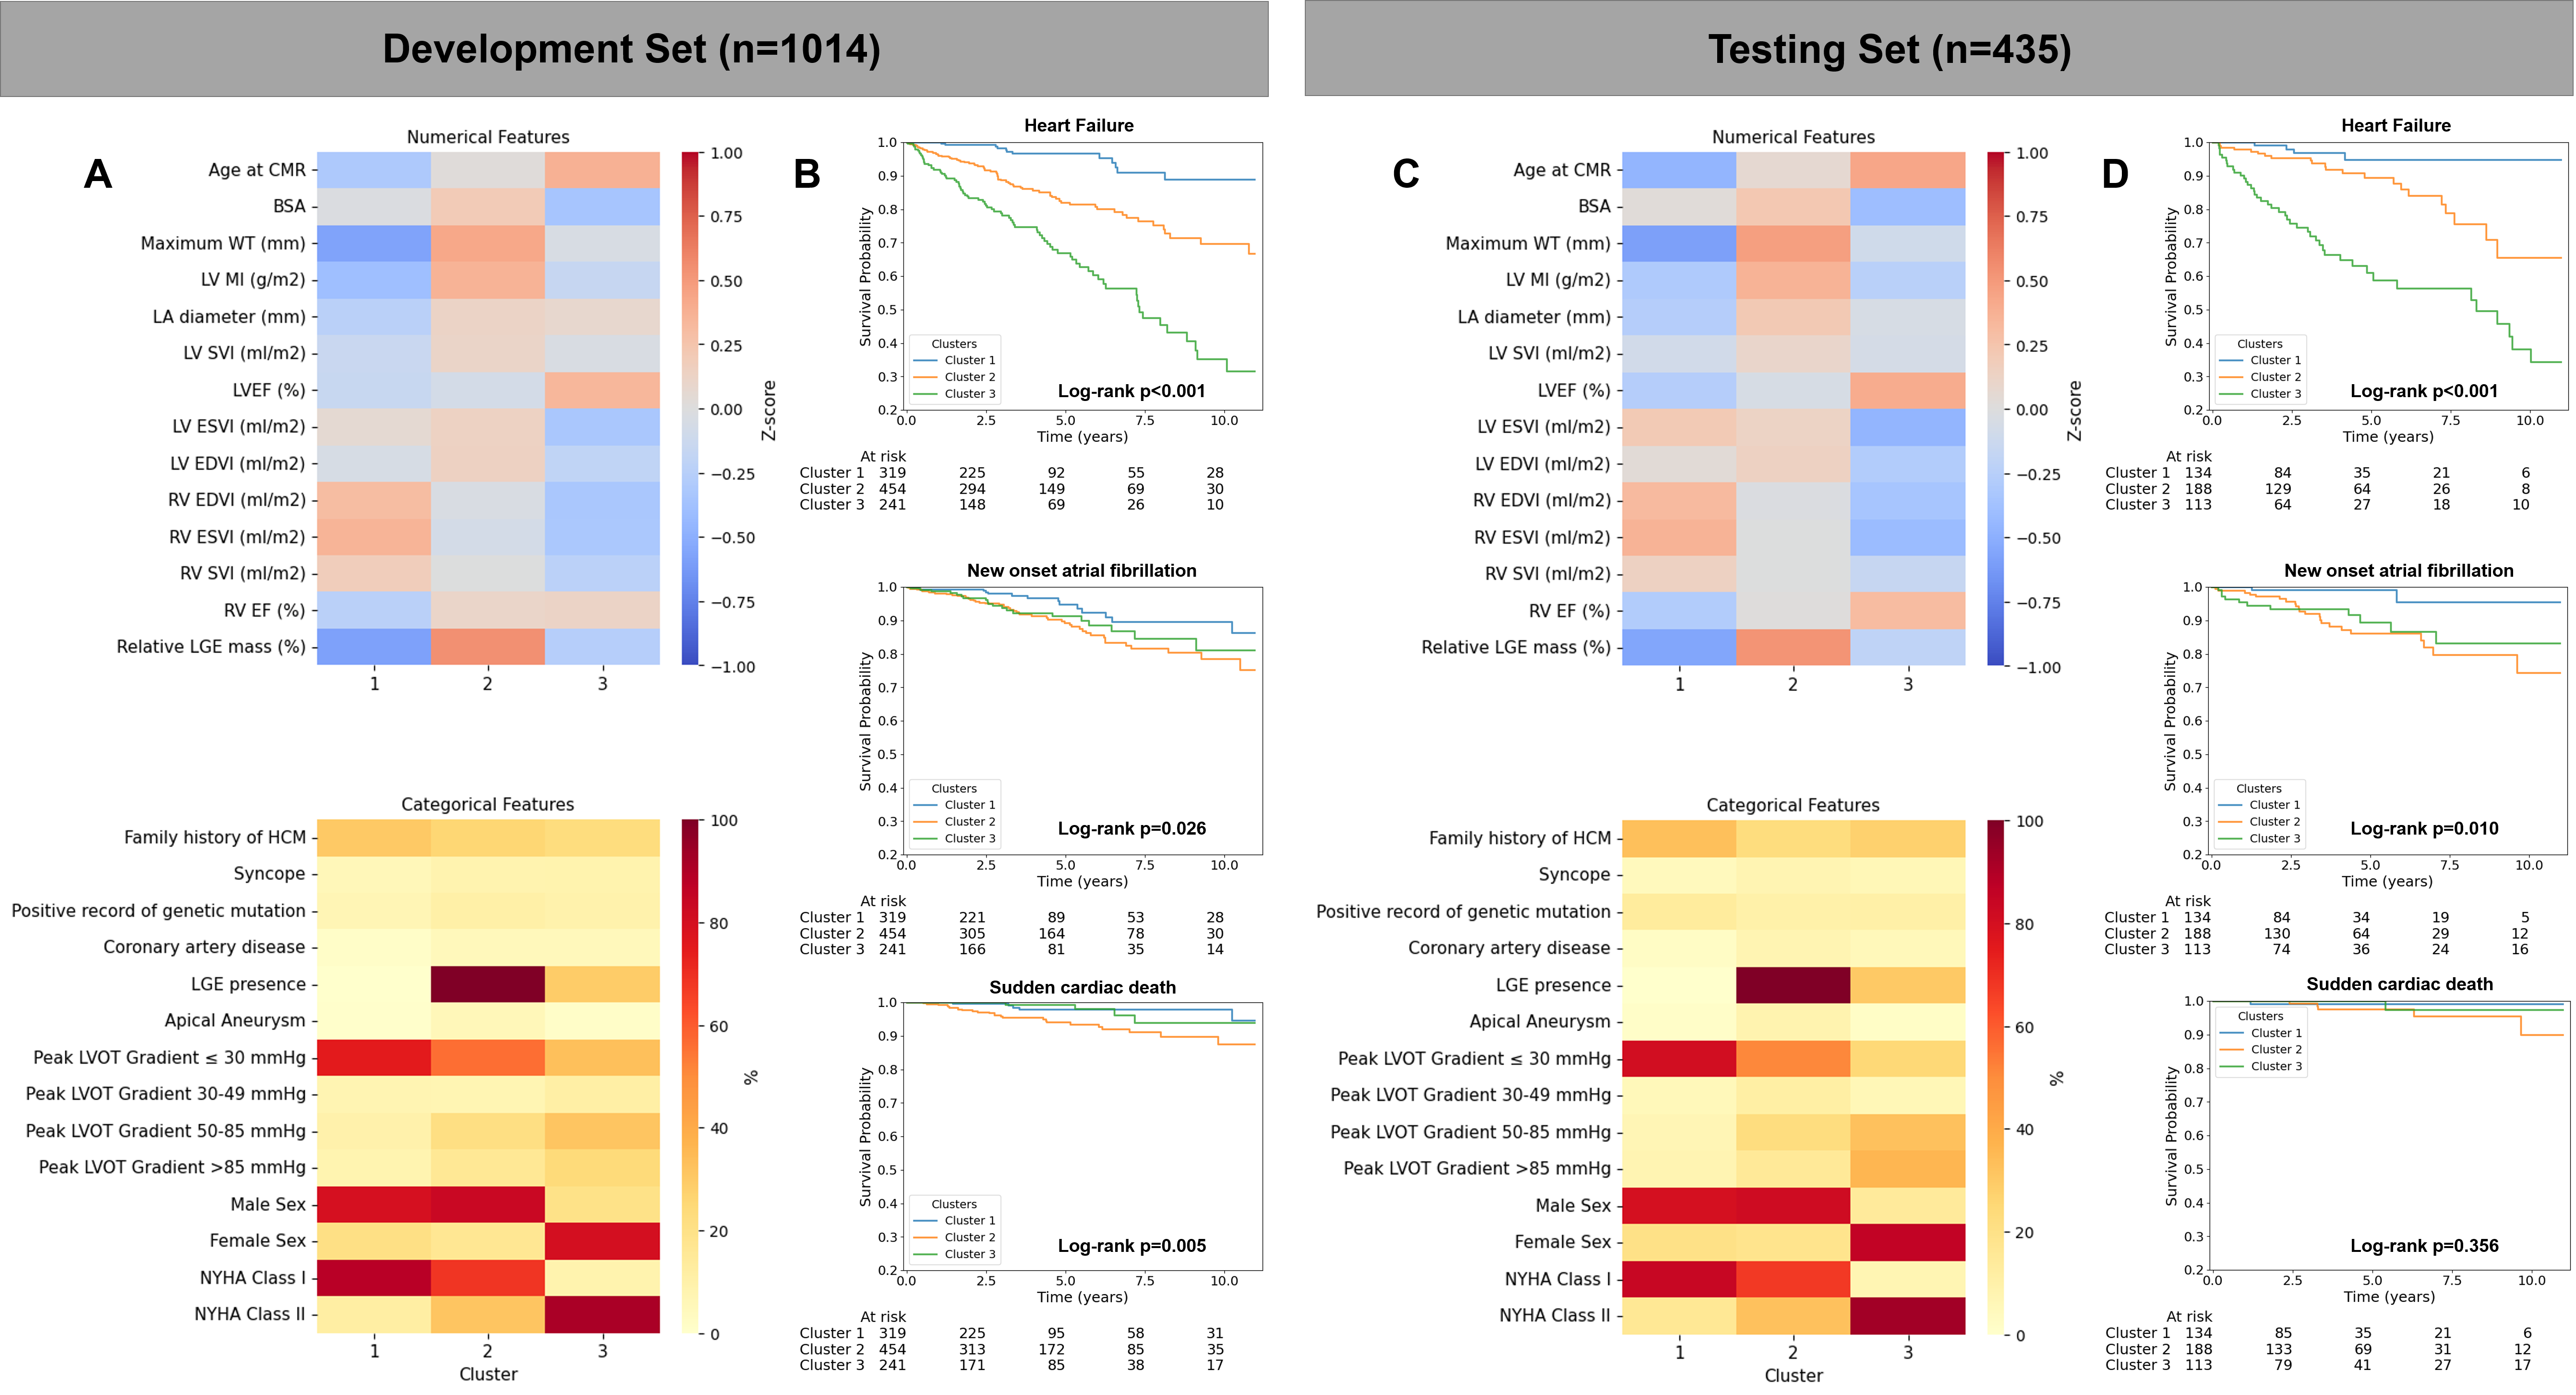
Continuous variables are presented as mean ± standard deviation and compared using either parametric t-tests or non-parametric Mann–Whitney U tests, as appropriate. Categorical variables are reported as frequencies with corresponding percentages and compared using the chi-squared test or Fisher’s exact test, where applicable.Abbreviations: BMI – body mass index; ICD – implantable cardioverter-defibrillator; NYHA – New York Heart Association; LVOT – left ventricular outflow tract; ACE – angiotensin-converting enzyme; ARB – angiotensin receptor blocker; LV/RV – left/right ventricle; LA – left atrium; WT – wall thickness; MI – mass index; EDVI/ESVI – end-diastolic/end-systolic volume index; SVI – stroke volume index; EF – ejection fraction; LGE – late gadolinium enhancement.Figure 1: Preprocessing of extracted features and unsupervised consensus clustering. A total of 23 features per patient (9 demographic and clinical variables, 14 CMR-derived features) were extracted. Missing data were imputed separately for numerical variables using the MissForest algorithm (based on a random forest model), and for categorical variables using multiple imputation by chained equations (MICE) with logistic regression models. The maximum missingness rate among features was 5.5%. Gower’s unified distance was then computed between individual patients by calculating differences in numerical and categorical features separately and combining them into a single distance metric. The resulting Gower distance matrix was resampled 100 times, each containing 80% of patients. Each of the 100 subsets was clustered using partitioning around medoids (PAM), and pairwise results were summarized in a consensus matrix to determine the optimal number of clusters. Abbreviations: BSA – body surface area; CAD – coronary artery disease; NYHA – New York Heart Association; AF – atrial fibrillation; LVOT – left ventricular outflow tract; LA – left atrium; LGE – late gadolinium enhancement.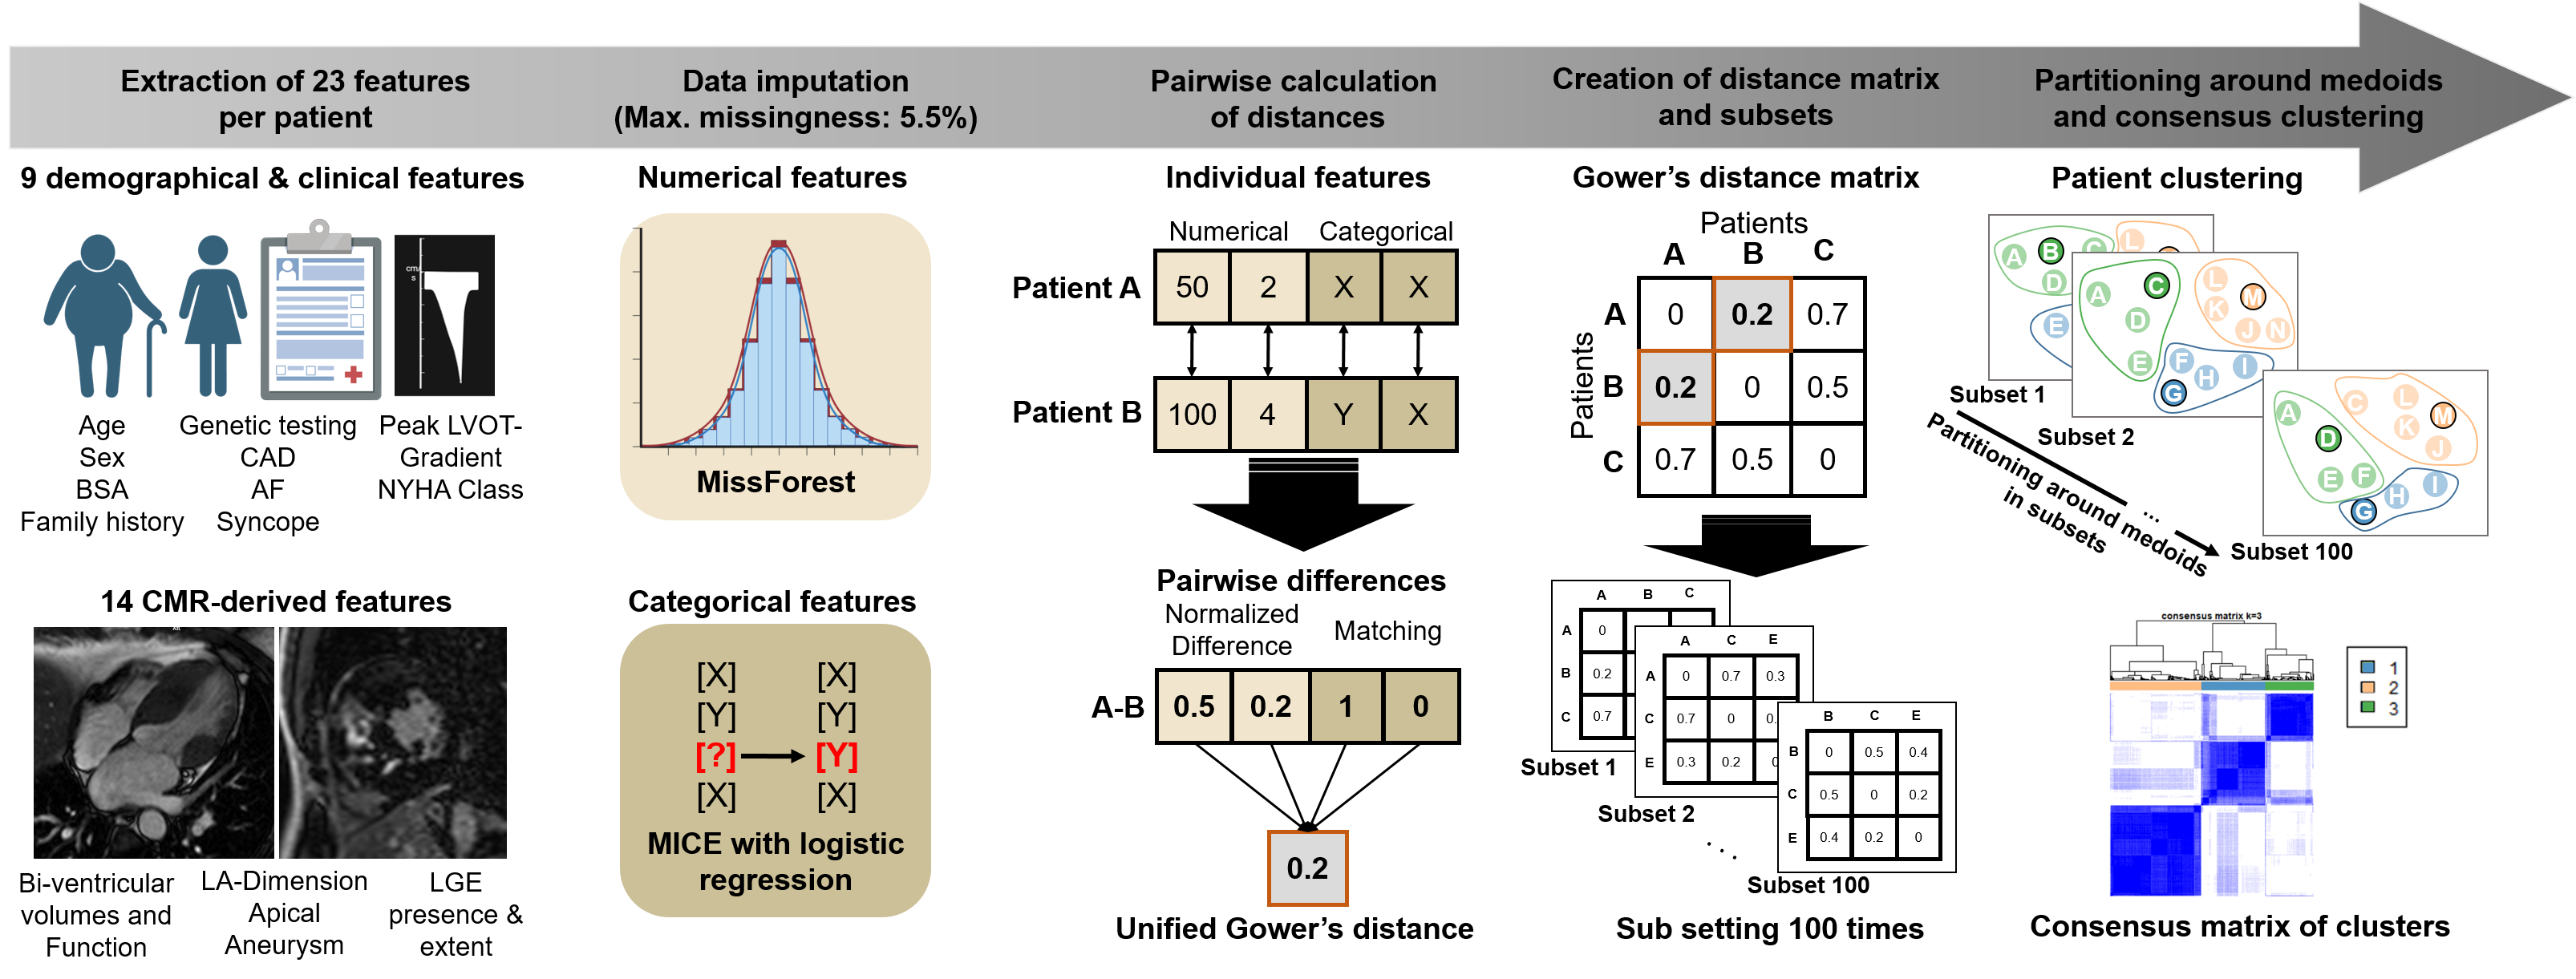 Figure 2. Patient clusters and adverse event rates across clusters in the development and testing set. Figure 2A and 2C display heatmaps of feature distributions across the identified clusters in the development and testing set. For numerical features, standardized Z-scores relative to the cohort mean are shown, with lower values (0 to -1) represented in shades of blue and higher values (0 to +1) in shades of red. For categorical features, the within-cluster frequency of each feature is visualized, with warmer colors indicating a higher proportion (%) of patients exhibiting that characteristic. Figure 2B and 2D show Kaplan–Meier survival curves for heart failure events, new-onset atrial fibrillation, and sudden cardiac death across the three clusters in the development and testing set, demonstrating differences in event rates for all outcomes between clusters. Abbreviations: BSA – body surface area; CAD – coronary artery disease; LV/RV – left/right ventricle; LA – left atrium; MI – mass index; EDVI/ESVI – end-diastolic/end-systolic volume index; SVI – stroke volume index; EF – ejection fraction; LGE – late gadolinium enhancement; WT – wall thickness; LVOT – left ventricular outflow tract; NYHA – New York Heart Association