
Rapid Fire Session

Kan N. Hor, MD
Director, Advanced Cardiovascular Imaging and Fellowship Program, Associate Division Chief for Research
Nationwide Children's Hospital and The Ohio State University
Columbus, OH, USA, Ohio, United States
Kan N. Hor, MD
Director, Advanced Cardiovascular Imaging and Fellowship Program, Associate Division Chief for Research
Nationwide Children's Hospital and The Ohio State University
Columbus, OH, USA, Ohio, United States
Amulya Buddhavarapu, MD
Assistant Professor
Nationwide Children's Hospital, United States

Hannah Jacobs, DO
Advanced Noninvasive Cardiac Imager
Nationwide Children's Hospital
Columbus, Ohio, United States
Megan Gunsaulus, MD
Physician, Pediatric Cardiology
Nationwide Children's Hospital
Columbus, Ohio, United States

Marc Lee, MD
Assistant Professor of Pediatrics
Nationwide Children's Hospital
Columbus, Ohio, United States

Rachel Tonnis, MD
Pediatric Advanced Cardiovascular Imaging Fellow
Nationwide Children's Hospital and The Ohio State University
Columbus, Ohio, United States

Christopher Schmitt, MD, MPH
Cardiac Advanced Imaging Fellow
Nationwide Children's Hospital
Columbus, Ohio, United States
Patient Characteristics (n = 75) | Study Group | LGE Negative Initial CMR | LGE Positive Initial CMR | P-Value (LGE - vs LGE +) |
Number of Subjects, n (%) | 75 (100%) | 45 (60%) | 30 (40%) | N/A |
Age at Baseline CMR (Years) | 14.8±6.2 | 12.3±3.7 | 18.5±7.4 | < 0.0001 |
Age at Follow-up CMR (Years) | 17.9±6.4 | 15.8±4.5 | 21.2±7.4 | 0.0001 |
Time Between CMR (Years) | 3.1±2.0 | 3.4±2.0 | 2.7±2.0 | 0.05 |
LGE - on all CMR, n (%) | 32 (42.7%) | 32 (42.7) | N/A | N/A |
Conversion from LGE - to LGE +,n (%) | 13 (17.3%) | 13 (17.3%) | N/A | N/A |
LGE + on all CMR, n (%) | 30 (40%) | N/A | 30 (40%) | N/A |
Baseline LVEF (%) | 59.9±7.6 | 63.1±5.4 | 55.1±8.0 | < 0.0001 |
Follow-up LVEF (%) | 55.5±10.5 | 60.3±6.7 | 48.3±11.1 | < 0.0001 |
Change in LVEF (%) from Baseline to Follow-Up (%) | (-) 4.4±7.0 | (-) 2.8±6.0 | (-) 6.8±7.8 | 0.007 |
Decline in LVEF% per Year | (-) 1.7±5.5 | (-) 0.4±2.1 | (-) 3.7±8.0 | 0.005 |
Patient Characteristics (n = 75) | Study Group | LGE Negative Initial CMR | LGE Positive Initial CMR | P-Value (LGE - vs LGE +) |
Number of Subjects, n (%) | 75 (100%) | 45 (60%) | 30 (40%) | N/A |
Age at Baseline CMR (Years) | 14.8±6.2 | 12.3±3.7 | 18.5±7.4 | < 0.0001 |
Age at Follow-up CMR (Years) | 17.9±6.4 | 15.8±4.5 | 21.2±7.4 | 0.0001 |
Time Between CMR (Years) | 3.1±2.0 | 3.4±2.0 | 2.7±2.0 | 0.05 |
LGE - on all CMR, n (%) | 32 (42.7%) | 32 (42.7) | N/A | N/A |
Conversion from LGE - to LGE +, n (%) | 13 (17.3%) | 13 (17.3%) | N/A | N/A |
LGE + on all CMR, n (%) | 30 (40%) | N/A | 30 (40%) | N/A |
Baseline LVEF (%) | 59.9±7.6 | 63.1±5.4 | 55.1±8.0 | < 0.0001 |
Follow-up LVEF (%) | 55.5±10.5 | 60.3±6.7 | 48.3±11.1 | < 0.0001 |
Change in LVEF (%) from Baseline to Follow-Up (%) | - 4.4±7.0 | - 2.8±6.0 | - 6.8±7.8 | 0.007 |
Decline in LVEF% per Year | - 1.7±5.5 | - 0.4±2.1 | - 3.7±8.0 | 0.005 |
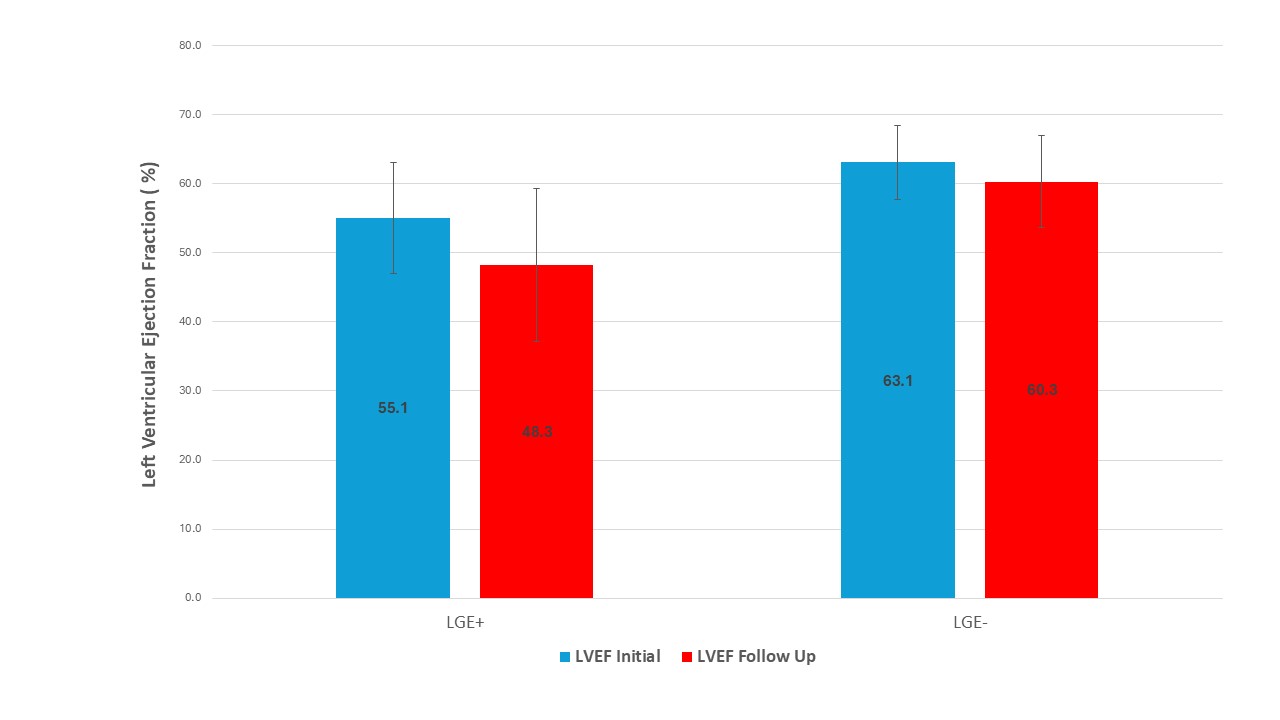 Figure 2: Longitudinal Scatter Plot of LGE Negative (blue lines), LGE negative converted to LGE positive (yellow lines) an LGE positive patients (red lines)
.jpg) Figure 2: Yearly LVEF Decline in LGE Negative (blue) compared to LGE positive (red) BMD patients
Figure 2: Yearly LVEF Decline in LGE Negative (blue) compared to LGE positive (red) BMD patients.jpg)
