Rapid Fire Session

Alexander Schulz, MD
Dr.
Harvard Medical School / BIDMC
Berlin, Berlin, Germany
Willemijn Leiner
Research Intern
Harvard Medical School, United States
Lily Peng
Research Assistant
Harvard Medical School, Massachusetts, United States
Ethan Rowin
Doctor
Lahey Hospital, United States

Amine Amyar, PhD
Instructor in medicine
Harvard Medical School - Beth Israel Deaconess Medical Center
Boston, Massachusetts, United States

Warren J. Manning, MD
Professor
Harvard Medical School
Boston, Massachusetts, United States
Martin S Maron, MD
Cardiologist
beth israel lahey health, Massachusetts, United States
Reza Nezafat, PhD
Professor
Harvard Medical School
Boston, Massachusetts, United States
Patient characteristics and medical history | No HF Event (n=215) | HF Event (n=69) | p-value |
Sex (male) | 78.1% (168) | 60.9% (42) | 0.004 |
Age at initial visit (years) | 48.57 ± 16.62 | 49.91 ± 14.40 | 0.519 |
Body mass index (kg/m2) | 29.29 ± 5.54 | 30.33 ± 5.41 | 0.183 |
NYHA Class II | 39.5% (85) | 79.7% (55) | < 0.001 |
Atrial fibrillation | 13.0% (28) | 13.0% (9) | 0.997 |
Arterial hypertension | 38.6% (83) | 33.3% (23) | 0.431 |
Coronary artery disease | 6.0% (13) | 4.3% (3) | 0.594 |
Family history of HCM | 20.9% (45) | 17.4% (12) | 0.523 |
Positive record of genetic mutation | 5.6% (12) | 4.3% (3) | 0.69 |
Apical aneurysm | 1.4% (3) | 0.0% (0) | 0.324 |
Mitral regurgitation |
|
|
|
Grade 1 | 29.8% (64) | 31.9% (22) | 0.739 |
Grade 2 | 1.9% (4) | 11.6% (8) | 0.001 |
Grade 3 | 0 (0.0%) | 0 (0.0%) | n/a |
Grade 4 | 0 (0.0%) | 0 (0.0%) | n/a |
Peak LVOT Gradient |
|
|
|
30-49 mmHg | 30.7% (66) | 15.9% (11) | 0.016 |
50-85 mmHg | 43.3% (93) | 40.6% (28) | 0.696 |
>85 mmHg | 26.0% (56) | 43.5% (30) | 0.006 |
Betablocker | 43.3% (93) | 63.8% (44) | 0.003 |
Calcium Channel Blockers | 19.5% (42) | 18.8% (13) | 0.899 |
ACE-Inhibitor/ ARB | 22.3% (48) | 18.8% (13) | 0.54 |
Disopyramide | 0.9% (2) | 1.4% (1) | 0.714 |
CMR | |||
Maximum WT (mm) | 17.70 ± 4.15 | 17.83 ± 3.92 | 0.815 |
LV mass index (g/m2) | 73.69 ± 23.59 | 73.83 ± 25.42 | 0.968 |
LA diameter (mm) | 38.67 ± 8.52 | 39.61 ± 8.33 | 0.417 |
LV end diastolic volume index (ml/m2) | 76.75 ± 16.41 | 75.36 ± 18.10 | 0.573 |
LV stroke volume index (ml/m2) | 51.15 ± 11.04 | 51.29 ± 12.03 | 0.933 |
LV ejection fraction (%) | 66.84 ± 6.67 | 68.12 ± 7.62 | 0.212 |
RV end diastolic volume index (ml/m2) | 69.50 ± 17.52 | 66.60 ± 17.90 | 0.244 |
RV stroke volume index (ml/m2) | 40.40 ± 10.85 | 39.08 ± 11.39 | 0.407 |
RV ejection fraction (%) | 58.57 ± 8.38 | 58.72 ± 7.59 | 0.897 |
RV GLS (%) | -24.57 ± 5.56 | -26.79 ± 4.70 | 0.001 |
RV Free Wall Strain (%) | -31.82 ± 7.22 | -34.34 ± 6.48 | 0.007 |
LGE presence | 46.0% (99) | 43.5% (30) | 0.709 |
Relative LGE mass (%) | 2.19 ± 4.04 | 1.28 ± 2.26 | 0.022 |
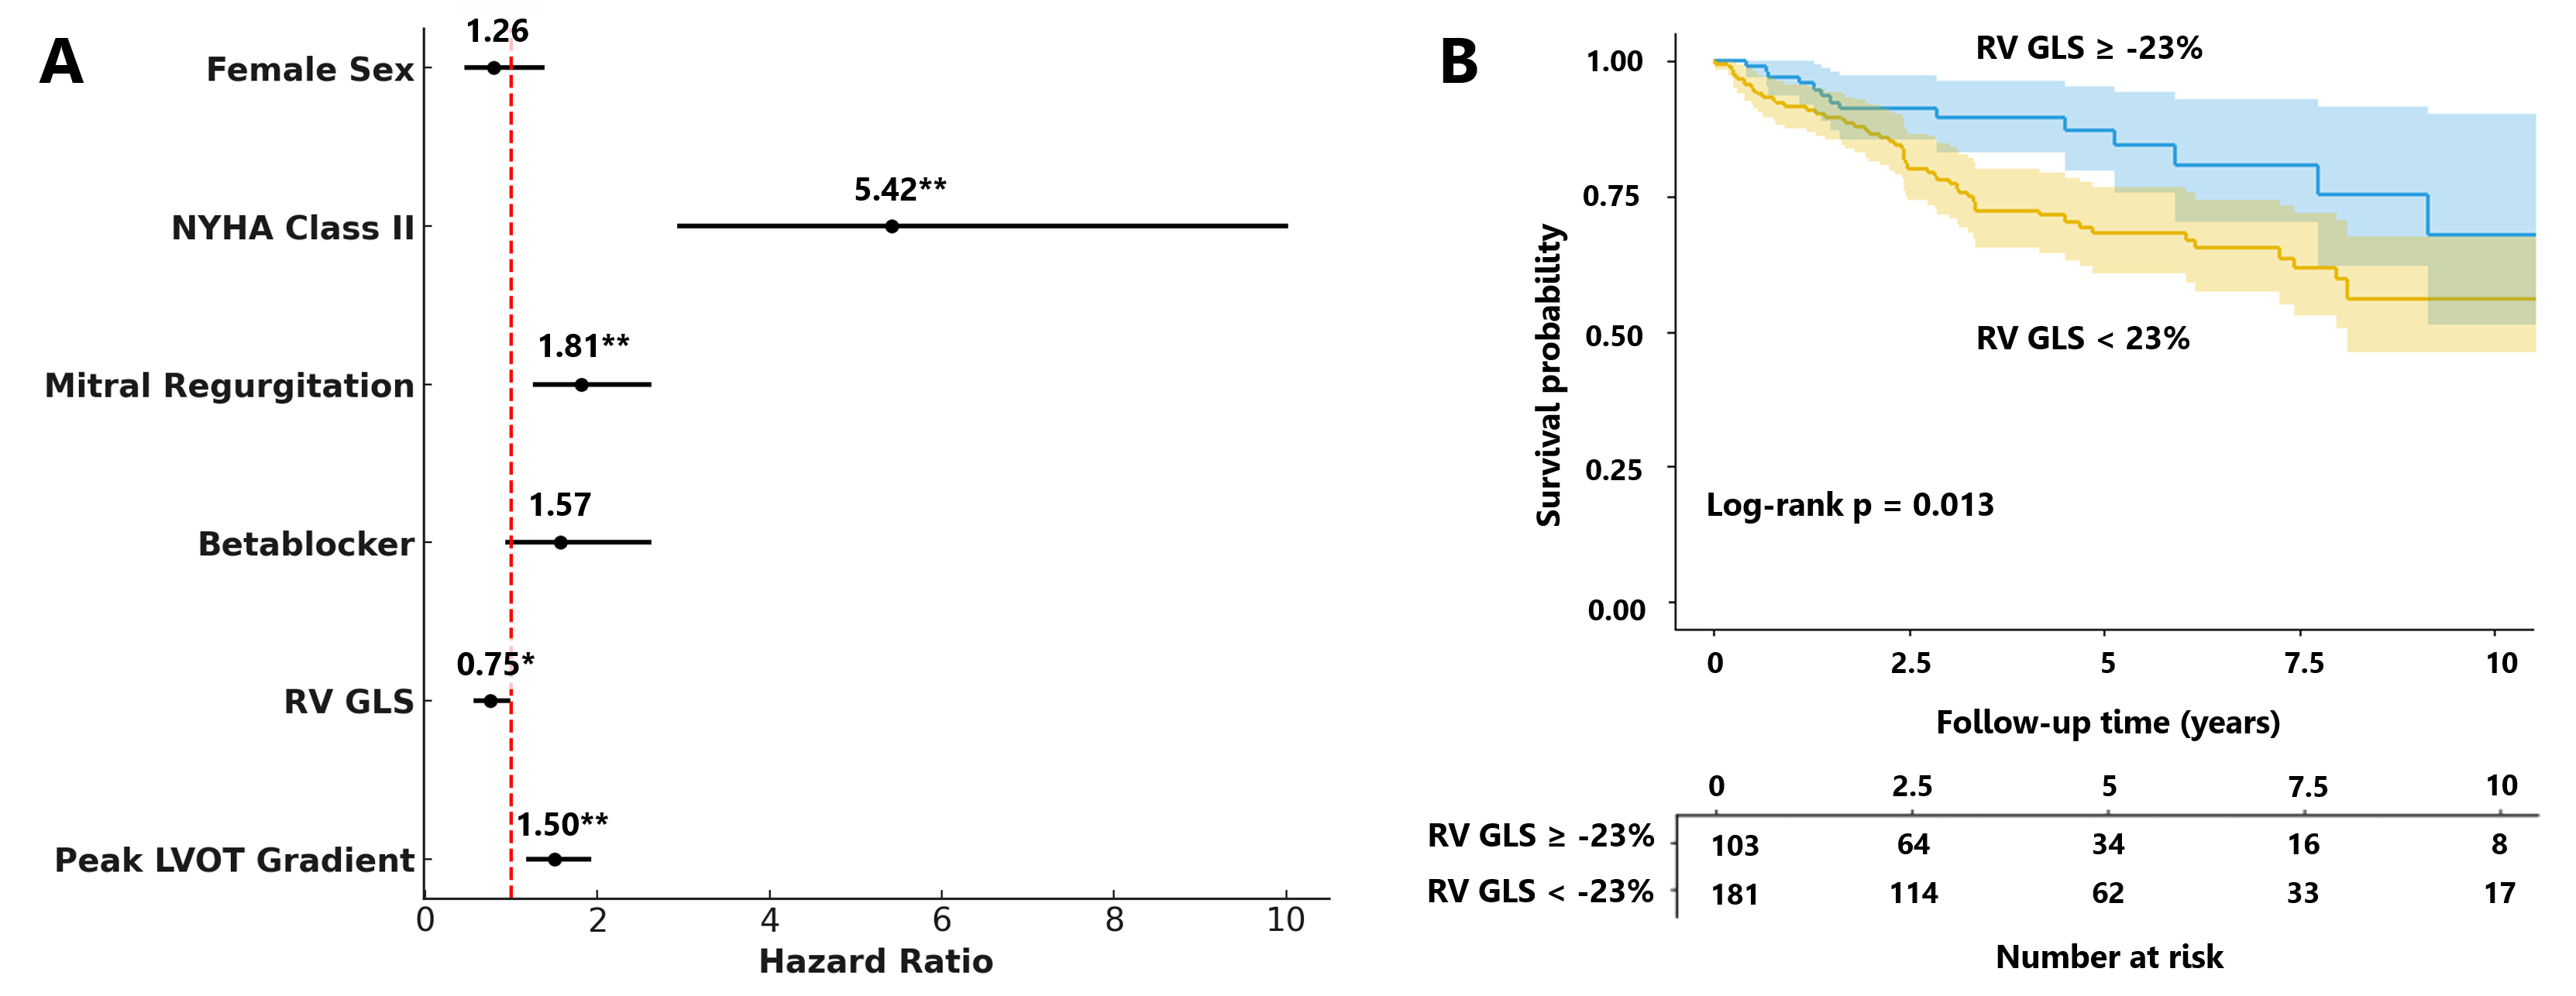
WT – Wall thickness, LVOT – Left ventricular outflow tract, ARB – Angiotensin II receptor blocker, LV/RV – Left/Right ventricle, LA – Left atrium, GLS – Global longitudinal strain, LGE – Late gadolinium enhancementFigure 1. Example of right ventricular feature tracking analysis in a patient with hypertrophic cardiomyopathy. Left: RV contouring for feature tracking analysis. Right: Corresponding RV strain curve. RA/LA = right/left atrium; LV/RV = left/right ventricle..png) Figure 2. Predictors of heart failure events (A) and Survival plot stratified by right ventricular global longitudinal strain. Forrest plots of multivariable Cox regression analysis and Kaplan–Meier curves for HF event–free survival, stratified by RV GLS (cut-off of -23%) * p<0.05, ** p<0.01
Figure 2. Predictors of heart failure events (A) and Survival plot stratified by right ventricular global longitudinal strain. Forrest plots of multivariable Cox regression analysis and Kaplan–Meier curves for HF event–free survival, stratified by RV GLS (cut-off of -23%) * p<0.05, ** p<0.01