Rapid Fire Session

Marilena Giannoudi, PhD, MSc
Academic Clinical Lecturer in Cardiology
University of Leeds
Leeds, England, United Kingdom
Marilena Giannoudi, PhD, MSc
Academic Clinical Lecturer in Cardiology
University of Leeds
Leeds, England, United Kingdom
Marcella Conning-Rowland
Phd Candidate
University of Leeds, United Kingdom

Nicholas Jex, PhD
Cardiologist
University of Leeds
Leeds, England, United Kingdom
Henry Procter, MBChB
Cardiology research fellow
University of Leeds
Leeds, England, United Kingdom
Sindhoora Kotha, BSc, MB
Cardiology Clinical Research Fellow
University of Leeds, Multidisciplinary Cardiovascular Research Centre and Biomedical Imaging Science Department, Leeds Institute of Cardiovascular and Metabolic Medicine, LS2 9JT, United Kingdom
Leeds, England, United Kingdom
Anna McGrane
Phd Student
University of Leeds, United Kingdom
Amanda MacCannell
Post Doc
University of Leeds, United Kingdom
David Beech, PhD
Professor
University of Leeds
Leeds, England, United Kingdom

Peter P. Swoboda, PhD
Consultant Cardiologist
Leeds Institute of Cardiovascular and Metabolic Medicine
Leeds, England, United Kingdom

Peter Kellman, PhD
Senior Scientist
National Institutes of Health
Bethesda, Maryland, United States

Sven Plein, MD, PhD
Professor of Cardiology
Leeds Institute of Cardiovascular and Metabolic Medicine
Leeds, England, United Kingdom
Mark Kearney
Professor of Cardiology
University of Leeds, United Kingdom
Lee Roberts
Professor of Molecular Physiology & Metabolism
University of Leeds, United Kingdom
Kathryn Griffin
Clinical Academic
University of Leeds, United Kingdom
Eylem Levelt
Academic Clinical Lecturer
Leeds Institute of Cardiovascular and Metabolic Medicine, University of Leeds
Leeds, England, United Kingdom
Richard Cubbon, PhD
Associate Professor
University of Leeds
Leeds, England, United Kingdom
Variable | V1 n= 34 | V2 n= 28 | P value | ||
Demographics | |||||
Age, y | 68 (66, 71) | 70 (68, 73) | 0.2749 | ||
Female, n (%) | 9 (26) | 6 (21) | 0.6446 | ||
BMI, kg/m2 | 29 (27, 31) | 29 (27, 31) | 0.6621 | ||
Heart rate, bpm | 71 (66, 75) | 67 (61, 74) | 0.3839 | ||
Systolic BP, mmHg | 133 (127, 140) | 134 (125, 144) | 0.9019 | ||
Diastolic BP, mmHg | 78 (74, 82) | 80 (75, 84) | 0.5332 | ||
Creatinine, umol/L | 77 (72, 82) | 81 (74, 87) | 0.3619 | ||
Haemoglobin, g/L | 145 (140, 149) | 143 (139, 148) | 0.7219 | ||
TG, mmol/L | 1.6 (1.2, 2.1) | 1.6 (1.2, 1.9) | 0.9252 | ||
HbA1c, mmol/mol | 40 [36, 43] | 41 [37, 45] | 0.4332 | ||
Glucose, mmol/L | 5.2 [5.0, 5.9] | 5.4 [4.9, 6.0] | 0.7989 | ||
NT- proBNP, ng/L | 294 [155, 1048] | 387 [204, 838] | 0.4351 | ||
AS Clinical Details | |||||
TTE Vmax, m/s | 4.5 (4.2, 4.7) | 2.5 (2.3, 2.8) | < 0.0001 | ||
6 min walk test, m | 412 (367, 455) | 453 (423, 483) | 0.1371 | ||
Cardiovascular Past Medical History | |||||
T2D, n(%) | 9 (26) | 5(18) | 0.4195 | ||
Stroke TIA, n(%) | 1 (3) | 1 (4) | 0.8888 | ||
(P)AF, n(%) | 6 (18) | 6 (21) | 0.7076 | ||
Hyperlipidemia, n (%) | 14 (41) | 12 (43) | 0.8938 | ||
CMR Results | |||||
LV end-diastolic volume indexed to BSA, mL/m2 | 76 (71, 80) | 67 (62, 71) | 0.0054 | ||
LV end-systolic volume indexed to BSA, ml/m2 | 28 (24, 31) | 25 (21, 28) | 0.2218 | ||
LV mass, g | 153 (138, 169) | 123 (112, 135) | 0.0040 | ||
LV mass indexed to BSA, g/m2 | 75 (68, 82) | 61 (57, 66) | 0.0015 | ||
LV mass to LV end-diastolic volume, g/mL | 1.0 (0.9, 1.1) | 0.9 (0.8, 1.0) | 0.1168 | ||
LV stroke volume indexed to BSA, ml/m2 | 48 (45, 52) | 43 (40, 46) | 0.0212 | ||
LV ejection fraction, % | 64 (61, 67) | 63 (59, 68) | 0.7550 | ||
LV maximal wall thickness, mm | 14.1 [12.7, 16.0] | 13.0 [11.0, 14.7] | 0.0924 | ||
LA biplane end-diastolic volumes, mL | 99 (80, 118) | 94 (75, 113) | 0.7304 | ||
LA biplane end-systolic volumes, mL | 69 (50, 89) | 68 (48, 88) | 0.9282 | ||
Biplane LA EF, % | 39 (33, 45) | 35 (26, 43) | 0.3517 | ||
GLS, % | 15 (14, 16) | 18 (16, 20) | 0.0165 | ||
Native T1, (ms) | 1299 (1284, 1315) | 1315 (1287, 1343) | 0.3112 | ||
Extra cellular volume fraction, (%) | 0.23 [0.21, 0.24] | 0.24 [0.23, 0.27] | 0.0037 | ||
LGE, (%) | 1.8 [0.8, 5.0] | 1.2 [0.0, 3.4] | 0.1234 | ||
Stress MBF, ml/min/g | 1.4 [1.1, 1.8] | 1.7 [1.1, 2.2] | 0.3068 | ||
Endo MBF Stress, ml/min/g | 1.2 [0.9, 1.6] | 1.6 [1.0, 2.0] | 0.2723 | ||
Epi MBF Stress, ml/min/g | 1.5 [1.2, 2.0] | 1.8 [1.1, 2.4] | 0.6063 | ||
Endo/Epi MBF Stress Ratio | 0.8 [0.7, 0.9] | 0.9 [0.8, 1.0] | 0.0166 | ||
Rest MBF, ml/min/g | 0.6 [0.6, 0.7] | 0.6 [0.5, 0.7] | 0.1810 | ||
Endo/Epi MBF Rest ratio | 1.0 [1.0, 1.1] | 1.1[1.1, 1.1] | 0.0002 | ||
MPR | 2.3 [1.8, 2.7] | 2.8 [2.0, 3.5] | 0.0749 | ||
Endo MPR | 1.9 [1.5, 2.2] | 2.3 [1.7, 3.0] | 0.0536 | ||
Epi MPR | 2.4 [1.9, 2.9] | 3.1 [2.1, 3.9] | 0.1346 | ||
Increase in RPP, % | 22 (16, 28) | 22 (15, 30) | 0.9755 | ||
|
|
| |||
AS, aortic stenosis; y, years; n, number; bpm, beats per minute; BMI, body mass index; BP, blood pressure; TG, triglycerides; HbA1c, glycemic hemoglobin; NT-proBNP, N-terminal-pro hormone b-type natriuretic peptide; TTE, trans-thoracic echocardiogram; V max, peak aortic forward flow velocity; T2D, type 2 diabetes; TIA, transient ischemic attack; (P)AF, (paroxysmal) atrial fibrillation.
LV indicates left ventricle; BSA, body surface area; SV, stroke volume; LA, left atrial; LA EF, left atrial ejection fraction; GLS, global longitudinal shortening; LGE, late gadolinium enhancement; RPP, rate pressure product; MBF, myocardial blood flow; Endo, endocardial; Epi, epicardial; MPR, myocardial perfusion reserve.
Normally distributed continuous variables are expressed as mean (±95% confidence intervals); nonparametric continuous variables are expressed as median [IQR]; and categorical variables are expressed as counts (percent).
P signifies p value for comparisons across the groups with ANOVA for normally distributed datasets and Kruskal-Wallis test for non-parametric tests.
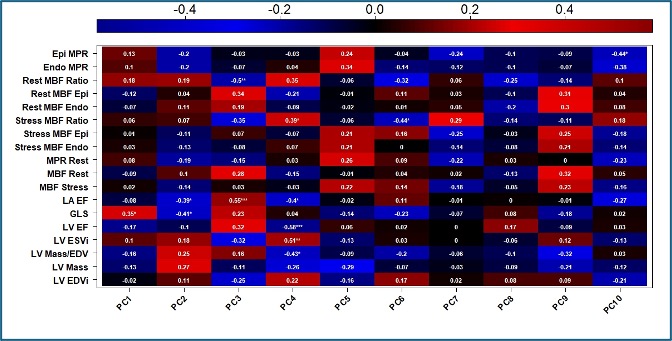
Figure1: Eigencor plot showing the correlation between principal components (1-10) on the x axis and cardiac MRI parameters from patients’ baseline study visit on the y axis. Colours indicate the strength and direction of the correlation, with red representing positive correlations and blue representing negative correlations. The scaled bar on the right represents correlation coefficients, and significance levels are denoted by asterisks (*p < 0.05, **p < 0.01, ***p < 0.001). PC, principal component; LVEDVi, indexed left ventricular end diastolic volume; LV Mass EDV, left ventricular mass to end diastolic volume ratio; LVESVi, left ventricular end systolic volume indexed; LVEF, left ventricular ejection fraction; GLS, global longitudinal strain; Atrial EF, atrial ejection fraction; MBF Stress, stress myocardial blood flow; MBF Rest, rest myocardial blood flow; MPR rest global, global myocardial perfusion reserve; Stress MBF Endo, endocardial stress myocardial blood flow; Stress MBF Epi, epicardial stress myocardial blood flow; Stress MBF Ratio, stress myocardial blood flow ratio; Rest MBF Endo, endocardial rest myocardial blood flow; Rest MBF epi, epicardial rest myocardial blood flow; Rest MBF ratio, rest myocardial blood flow ratio; Endo MPR, endocardial myocardial perfusion reserve; Epi MPR, epicardial myocardial perfusion reserve. 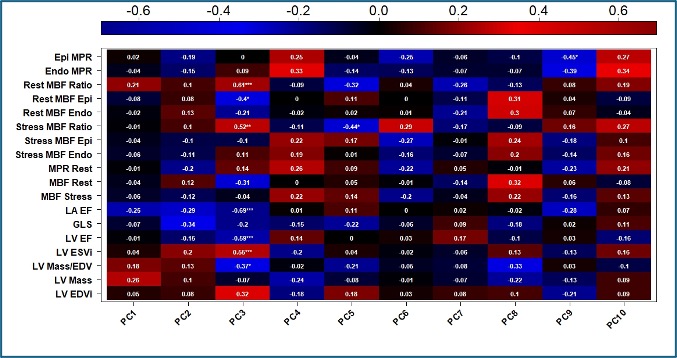 Figure 2: Eigencor plot showing the correlation between principal components (1-10) on the x axis and cardiac MRI parameters from patients’ follow up study visit on the y axis. Colours indicate the strength and direction of the correlation, with red representing positive correlations and blue representing negative correlations. The scaled bar on the right represents correlation coefficients, and significance levels are denoted by asterisks (*p < 0.05, **p < 0.01, ***p < 0.001). PC, principal component; LVEDVi, indexed left ventricular end diastolic volume; LV Mass EDV, left ventricular mass to end diastolic volume ratio; LVESVi, left ventricular end systolic volume indexed; LVEF, left ventricular ejection fraction; GLS, global longitudinal strain; Atrial EF, atrial ejection fraction; MBF Stress, stress myocardial blood flow; MBF Rest, rest myocardial blood flow; MPR rest global, global myocardial perfusion reserve; Stress MBF Endo, endocardial stress myocardial blood flow; Stress MBF Epi, epicardial stress myocardial blood flow; Stress MBF Ratio, stress myocardial blood flow ratio; Rest MBF Endo, endocardial rest myocardial blood flow; Rest MBF epi, epicardial rest myocardial blood flow; Rest MBF ratio, rest myocardial blood flow ratio; Endo MPR, endocardial myocardial perfusion reserve; Epi MPR, epicardial myocardial perfusion reserve.