Rapid Fire Session

Cassady Palmer, BSc
Research Associate
The Christ Hospital Health Network
Cincinnati, Ohio, United States
Cassady Palmer, BSc
Research Associate
The Christ Hospital Health Network
Cincinnati, Ohio, United States
Suzanne Smart, BSc, CCRP
Research Associate
The Ohio State University, United States
Christian Schmidt, PhD
Biomedical Statistician
The Christ Hospital Health Network, United States
Karolina Zareba, M.D.
Assistant Professor of Medicine, Associate Program Director, Cardiovascular Diagnostics Training Program
The Ohio State University Wexner Medical Center
Columbus, Ohio, United States

Deborah Kwon, MD, FSCMR
Director of Cardiac MRI
Cleveland Clinic
Cleveland, Ohio, United States
Wojciech M Mazur, MD
Director of Advanced Cardiac Imaging
The Christ Hospital Health Network
Cincinnati, Ohio, United States
Patient Demographics N=23 Enrolling Site, n (%) TCH OSU CCF 8 (35) 5 (22) 10 (43) Sex (Male), n (%) 21 (91) Race, n (%) Black or African American White 5 (22) 18 (78) Hispanic Ethnicity, n (%) 0 (0) Amyloid History Endomyocardial biopsy, n (%) ATTR Amyloid Result 2 (10) 2 (100) TcPYP, n (%) 20 (95) Visual Myocardial Uptake, n (%) 17 (100) Planar Grade, n (%) 2 3 4 (24) 13 (76) Heart to Contralateral Ratio, median (IQR) 1.69 (1.48, 1.82) SPECT/CT, n (%) Diffuse Focal 12 (57) 9 (90) 1 (10) Serum FLC kappa, median (IQR) 25 (22.2, 38.7) Serum FLC lambda, median (IQR) 20.8 (16.4, 23.6) Serum FLC ratio, median (IQR) 1.41 (1.24, 1.97) Bone marrow biopsy, n (%) 1 (5) Type of Mutation, n (%) Wild Type Variant 21 (91) 2 (9) Mutation Variants, n (%) Val142Ile 2 Prior Treatments, n (%) 0 (0) Medical History Hypertension 17 (81) Hyperlipidemia 17 (81) Diabetes 5 (25) Smoking Status Former Never 12 (55) 10 (45) NYHA Class I II III 3 (14) 12 (57) 6 (29) Atrial Fibrillation Chronic Paroxysmal Permanent 14 (64) 7 (50) 6 (43) 1 (7) Coronary artery disease 7 (32) COPD 2 (9) PVD 2 (9) Cerebrovascular accident (stroke) 1 (5) Myocardial Infarction LAD 2 (9) 1 Carpal Tunnel 20 (91) Spinal stenosis 11 (50) Biceps tendon rupture 2 (9) Surgical PCI LCx 3 (14) 2 CABG 1 (5) Carpal tunnel release 15 (71) Spinal Stenosis 7 (33) Knee replacement 7 (33) Shoulder surgery 4 (19) Hip surgery 4 (19) Labs Baseline assessment Follow-up p-value Serum creatinine 1.27 ± 0.38 1.30 ± 0.40 0.929 GFR 56.8 ± 16.5 56.4 ± 21.9 0.962 Hematocrit 41.7 ± 5.3 43.0 ± 3.0 ^0.025 Hemoglobin 13.6 ± 2.0 14.1 ± 1.1 0.0495 Sodium 139.3 ± 3.3 139.6 ± 3.1 0.314 BUN 27.2 ± 12.6 24.1 ± 10.6 0.657 Prealbumin 22.5 ± 11.2 N = 1 NA Calcium 9.40 ± 0.46 9.47 ± 0.53 0.370 NT-pro BNP 1971 ± 2551 1528 ± 1195 0.648 Troponin T 73.2 ± 231.5 NA NA TTR Tetrameric Stability NA NA NA 6MWT Baseline assessment Follow-up p-value Systolic BP 125.9 ± 14.7 125.0 ± 14.4 0.707 Diastolic BP 72.3 ± 9.9 70.1 ± 9.9 0.491 Heart Rate 74.3 ± 12.0 78.8 ± 10.7 ^0.004 Dyspnea Change 3.38 ± 3.34 1.80 ± 2.44 ^0.109 Dyspnea (pre-test) 0.63 ± 1.13 1.80 ± 2.90 ^0.063 Dyspnea (post-test) 4.00 ± 3.56 3.60 ± 3.47 ^1.000 Fatigue Change 1.53 ± 2.09 0.90 ± 1.10 0.705 Fatigue (pre-test) 1.59 ± 1.80 2.60 ± 2.99 0.159 Fatigue (post-test) 3.13 ± 2.83 3.50 ± 3.44 0.322 SpO2 Change 0.06 ± 1.29 -1.33 ± 2.29 0.153 SpO2 (pre-test) 96.8 ± 2.3 95.9 ± 2.8 0.578 SpO2 (post-test) 96.8 ± 2.0 94.6 ± 4.1 0.153 Supplemental Oxygen 0 0 NA Number of full 60-meter laps 5.18 ± 1.80 5.50 ± 2.37 0.678 Final partial lap 17.9 ± 16.2 22.5 ± 31.8 (N=2) N A Total Distance 296.1 ± 110.5 334.5 ± 143.9 0.860 KCCQ-12 Baseline assessment Follow-up p-value Physical Function Score 68.3 ± 28.3 63.2 ± 32.5 0.024 Symptom Frequency Score 72.9 ± 25.4 79.4 ± 21.0 ^0.576 Quality of Life Score 56.3 ± 34.9 65.8 ± 27.3 ^0.516 Social Limitation Score 65.4 ± 35.4 75.9 ± 32.5 ^0.367 Overall Score 66.6 ± 28.5 72.4 ± 25.4 ^0.562 ^ Signed-rank test instead of paired t-test due to violation of assumptions.Cardiac MRI functional and tissue characteristic values Cardiac MRI Baseline assessment Follow-up p-value LVEDV 176.5 ± 41.2 170.4 ± 40.9 0.281 LVEDV Index 87.0 ± 14.7 81.9 ± 16.8 0.238 LVESV 84.8 ± 25.0 94.4 ± 30.8 ^0.975 LVESV Index 41.8 ± 9.7 45.7 ± 11.9 0.469 LVEF 51.7 ± 8.6 45.1 ± 9.1 0.049 LV Mass 166 (145, 203) 159 (151, 216) 0.996 LV Mass Index 84.4 (73.7, 92.1) 83 (66.3, 105.5) 0.650 RVEDV 169.1 ± 43.9 166.0 ± 48.1 0.562 RVEDV Index 82.2 ± 19.3 80.5 ± 24.6 0.614 RVESV 88.0 ± 30.6 90.0 ± 30.2 0.802 RVESV Index 42.6 ± 15.2 43.1 ± 14.6 0.502 RVEF 48.5 ± 8.3 45.5 ± 10.8 0.569 LA Area 29.5 ± 10.0 26.5 ± 6.1 0.285 LA Volume 78.7 ± 51.3 74.0 ± 39.8 0.575 RA Area 24.6 ± 6.1 25.4 ± 6.0 0.316 RA Volume 56.4 ± 37.1 51.4 ± 33.5 ^ 0.109 Aortic Regurgitation None Mild Moderate 11 (92) 1 (8) 0 10 (83) 1 (8) 1 (8) 1.00 Mitral Regurgitation None Mild 9 (69) 4 (31) 8 (62) 5 (38) 1.00 Tricuspid Regurgitation None Mild 10 (77) 3 (23) 12 (92) 1 (8) 0.500 Cardiac MRI Strain (%) Baseline assessment Follow-up p-value Global circumferential -13.75 ± 3.97 -12.65 ± 2.23 0.310 Endocardial circumferential -17.26 ± 5.90 -15.35 ± 4.70 0.208 Epicardial circumferential -12.15 ± 4.28 -10.86 ± 3.85 0.199 Global radial 21.40 ± 9.47 18.42 ± 4.39 0.234 Endocardial radial 27.57 ± 11.83 22.23 ± 8.00 0.143 Epicardial radial 16.55 ± 6.55 14.35 ± 5.57 0.203 Global longitudinal -9.58 ± 3.33 -9.05 ± 2.12 0.232 Endocardial longitudinal -10.43 ± 3.12 -10.46 ± 3.07 0.211 Epicardial longitudinal -10.21 ± 3.56 -9.85 ± 2.79 ^0.742 Peak Systolic Strain Rates Global circumferential -0.78 ± 0.32 -0.73 ± 0.21 ^0.742 Endocardial circumferential -0.93 ± 0.31 -0.90 ± 0.36 0.859 Epicardial circumferential -0.62 ± 0.23 -0.58 ± 0.21 0.864 Global radial 1.53 ± 0.86 1.28 ± 0.53 ^0.859 Endocardial radial 2.31 ± 1.54 1.89 ± 0.99 0.691 Epicardial radial 1.25 ± 0.68 1.02 ± 0.54 0.556 Global longitudinal -0.53 ± 0.23 -0.59 ± 0.17 0.582 Endocardial longitudinal -0.67 ± 0.28 -0.73 ± 0.23 0.641 Epicardial longitudinal -0.59 ± 0.24 -0.65 ± 0.29 0.584 Early Diastolic Strain Rates Global circumferential 0.55 ± 0.18 0.57 ± 0.27 0.900 Endocardial circumferential 0.66 ± 0.23 0.68 ± 0.34 0.857 Epicardial circumferential 0.48 ± 0.19 0.50 ± 0.25 0.845 Global radial -1.15 ± 0.43 -1.06 ± 0.56 0.643 Endocardial radial -1.62 ± 0.69 -1.41 ± 0.66 0.254 Epicardial radial -0.70 ± 0.65 -0.82 ± 0.45 0.672 Global longitudinal 0.40 ± 0.14 0.35 ± 0.16 0.504 Endocardial longitudinal 0.54 ± 0.16 0.47 ± 0.22 0.583 Epicardial longitudinal 0.53 ± 0.22 0.46 ± 0.27 ^0.547 Peak Late Diastolic Strain Rates Global circumferential 0.58 ± 0.24 0.56 ± 0.18 0.397 Endocardial circumferential 0.74 ± 0.38 0.66 ± 0.41 ` Epicardial circumferential 0.52 ± 0.24 0.48 ± 0.32 ^0.766 Global radial -0.71 ± 0.29 -0.66 ± 0.22 0.223 Endocardial radial -0.93 ± 0.51 -0.81 ± 0.47 0.119 Epicardial radial -0.67 ± 0.32 -0.54 ± 0.38 0.074 Global longitudinal 0.38 ± 0.19 0.42 ± 0.21 ^0.625 Endocardial longitudinal 0.45 ± 0.19 0.63 ± 0.30 0.219 Epicardial longitudinal 0.43 ± 0.21 0.56 ± 0.30 0.668 Cardiac MRI Mapping Baseline assessment Follow-up p-value T1 Mapping – SAX base Septal Native T1 1198 ± 144 1194 ± 130 0.321 Global Native T1 1218 ± 136 1193 ± 129 0.431 Blood Pool native T1 1760 ± 194 1598 ± 266 0.067 Septal Post contrast T1 397 ± 105 324 ± 104 0.038 Global post contrast T1 411 ± 109 336 ± 104 0.159 Blood pool post contrast T1 380 ± 107 333 ± 103 0.200 Septal Extracellular Volume 51.1 ± 15.4 59.3 ± 19.1 0.070 Global Extracellular volume 50.2 ± 13.5 56.6 ± 14.6 0.567 T1 Mapping – SAX Mid Septal Native T1 1213 ± 154 1179 ± 111 0.471 Global Native T1 1177 ± 129 1151 ± 104 0.496 Blood Pool native T1 1761 ± 207 1666 ± 151 0.246 Septal Post contrast T1 384 ± 102 343 ± 116 0.221 Global post contrast T1 408 ± 81 374 ± 121 0.617 Blood pool post contrast T1 380 ± 107 339 ± 111 0.401 Septal Extracellular Volume 53.7 ± 11.8 54.2 ± 17.0 1.000^ Global Extracellular volume 48.4 ± 11.9 48.1 ± 12.6 0.857 T1 Mapping – SAX Apex Septal Native T1 1211 ± 147 1173 ± 98 0.690 Global Native T1 1161 ± 129 1165 ± 107 0.248 Blood Pool native T1 1775 ± 204 1697 ± 175 0.272 Septal Post contrast T1 446 ± 121 351 ± 104 0.628 Global post contrast T1 445 ± 86 394 ± 124 0.704 Blood pool post contrast T1 424 ± 108 338 ± 109 0.650 Septal Extracellular Volume 49.8 ± 12.2 51.3 ± 13.8 0.056 Global Extracellular volume 44.5 ± 9.9 50.0 ± 11.5 0.113 T1 Mapping – HLA Septal Native T1 1188 ± 142 1141 ± 177 0.423 Global Native T1 NA NA --- Blood Pool native T1 1709 ± 180 1638 ± 105 0.215 Septal Post contrast T1 386 ± 96 313 ± 83 0.011 Global post contrast T1 NA NA --- Blood pool post contrast T1 371 ± 77 306 ± 45 0.033 Septal Extracellular Volume 53.3 ± 16.6 54.0 ± 13.4 0.448 Global Extracellular volume NA NA --- Mean ECV Septal mean ECV 52.0 ± 13.8 56.4 ± 17.2 0.169 Global mean ECV 49.2 ± 11.7 53.0 ± 13.2 0.558 ^ Signed-rank test instead of paired t-test due to violation of assumptions.CMR quantified LV mass demonstrating baseline and follow up 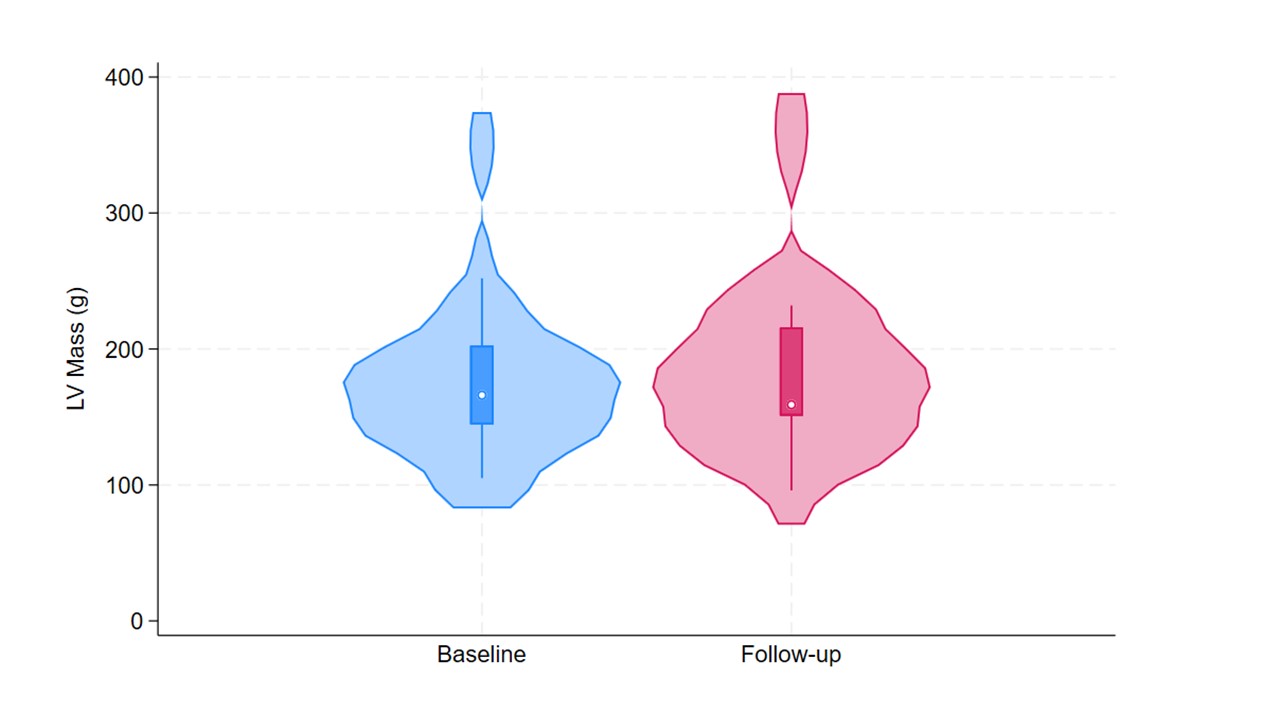 Septal and mean global extracellular volumes at baseline and follow up
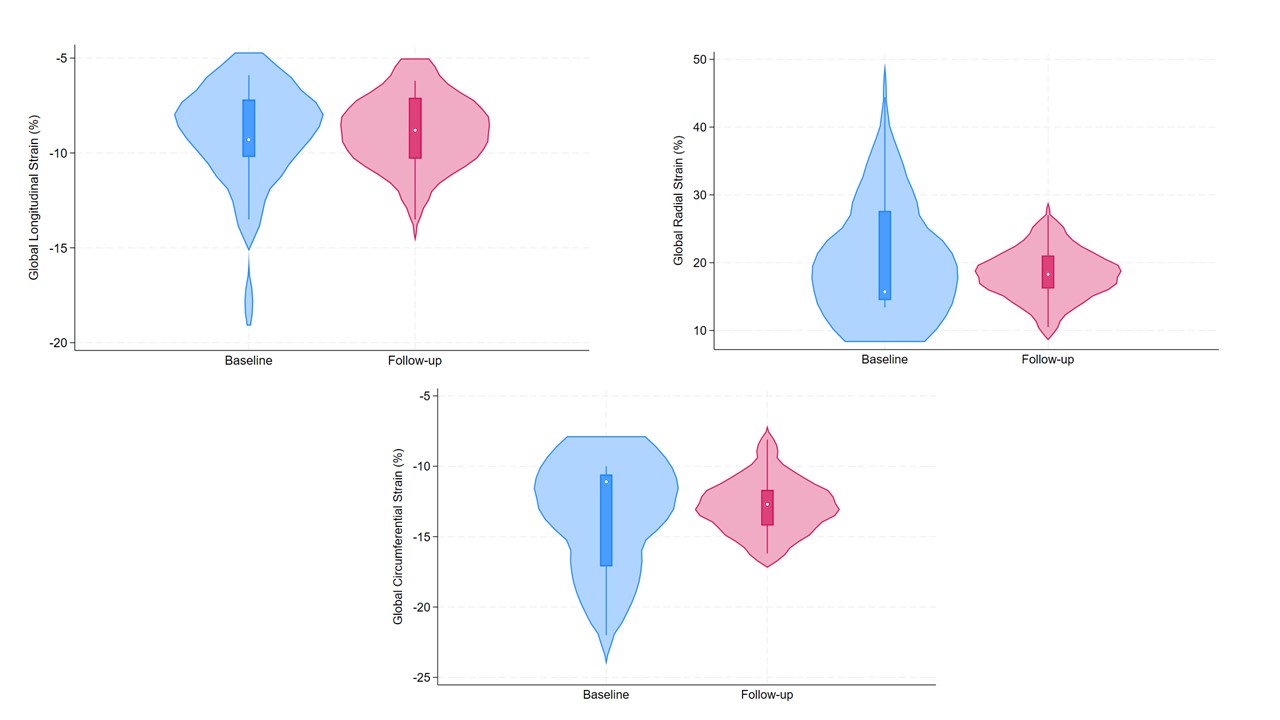
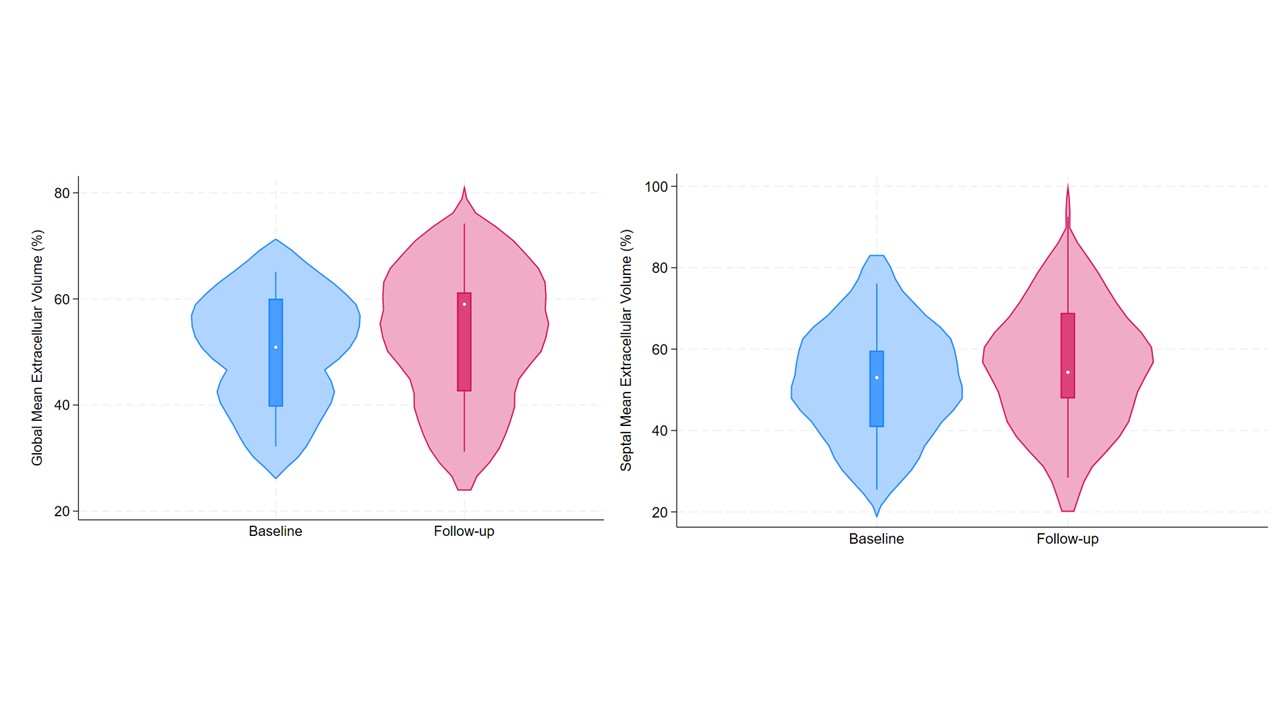 Global CMR feature tracking strain values at baseline and follow up