Rapid Fire Session

M. Berk Sahin
PhD student
Purdue University
West Lafayette, Indiana, United States
M. Berk Sahin
PhD student
Purdue University
West Lafayette, Indiana, United States

Zhuoan Li, MSc
PhD Candidate
Laboratory for Translational Imaging for Microcirculation, Weldon School of Biomedical Engineering, Purdue University
Indianapolis, Indiana, United States

Khalid Youssef, PhD, MSc
Assistant Professor
Indiana University, Department of Radiology and Imaging Sciences
Indianapolis, Indiana, United States
Arian M. Sohi, BSc
PhD Student
Laboratory for Translational Imaging for Microcirculation, Weldon School of Biomedical Engineering, Purdue University
Indianapolis, Indiana, United States
Dilek M. Yalcinkaya, MSc
PhD Candidate
Purdue University
West Lafayette, Indiana, United States
Luis Zamudio, BSc
Research Engineer
Purdue University
Indianapolis, Indiana, United States

Michael D. Elliott, MD
Director of Cardiac MRI
Atrium Health
Charlotte, North Carolina, United States

Venkateshwar Polsani, MD
Director of Cardiovascular Imaging
Piedmont Heart Institute
Atlanta, Georgia, United States
Matthew S. Tong, DO
Associate Professor - Clinical
The Ohio State University
Columbus, Ohio, United States

Dipan J. Shah, MD
Chief, Division of Cardiovascular Imaging Director, Cardiovascular MRI Laboratory
Weill Cornell Medical College, Houston Methodist DeBakey Heart and Vascular Center, Houston, Texas, USA
Houston, Texas, United States

Orlando P. Simonetti, PhD, FSCMR
Professor
The Ohio State University
Columbus, Ohio, United States
Abolfazl Hashemi, PhD, MSc, BSc
Assistant Professor
Purdue University, Indiana, United States
Behzad Sharif, PhD
Associate Professor
Purdue University
Indianapolis, Indiana, United States
.png) Figure 2: Representative cases from different centers showing the segmentations obtained with the 3D U-Net, the proposed method, and the corresponding manually drawn reference contours. For each center, the columns show (from left to right) the manually drawn contours followed by the automatic segmentations generated with the 3D U-Net and the proposed method, respectively. The number of patients with manual contours each method used for training or fine-tuning is indicated by “n”. Each row shows a different cardiac phase in FPP CMR: left ventricular (LV) enhancement, right ventricular (RV) enhancement, and myocardial enhancement. Dice score between the manual contour and the segmentation generated by the corresponding method is shown in yellow at the bottom-right corner of each perfusion image. The proposed method achieved segmentation accuracy comparable to the 3D U-Net, as reflected by Dice scores, despite being trained with substantially fewer manual contours. Importantly, in specific scenarios, such as the RV and myo. enhancement phase in center 2, it outperformed the 3D U-Net by a considerable margin.
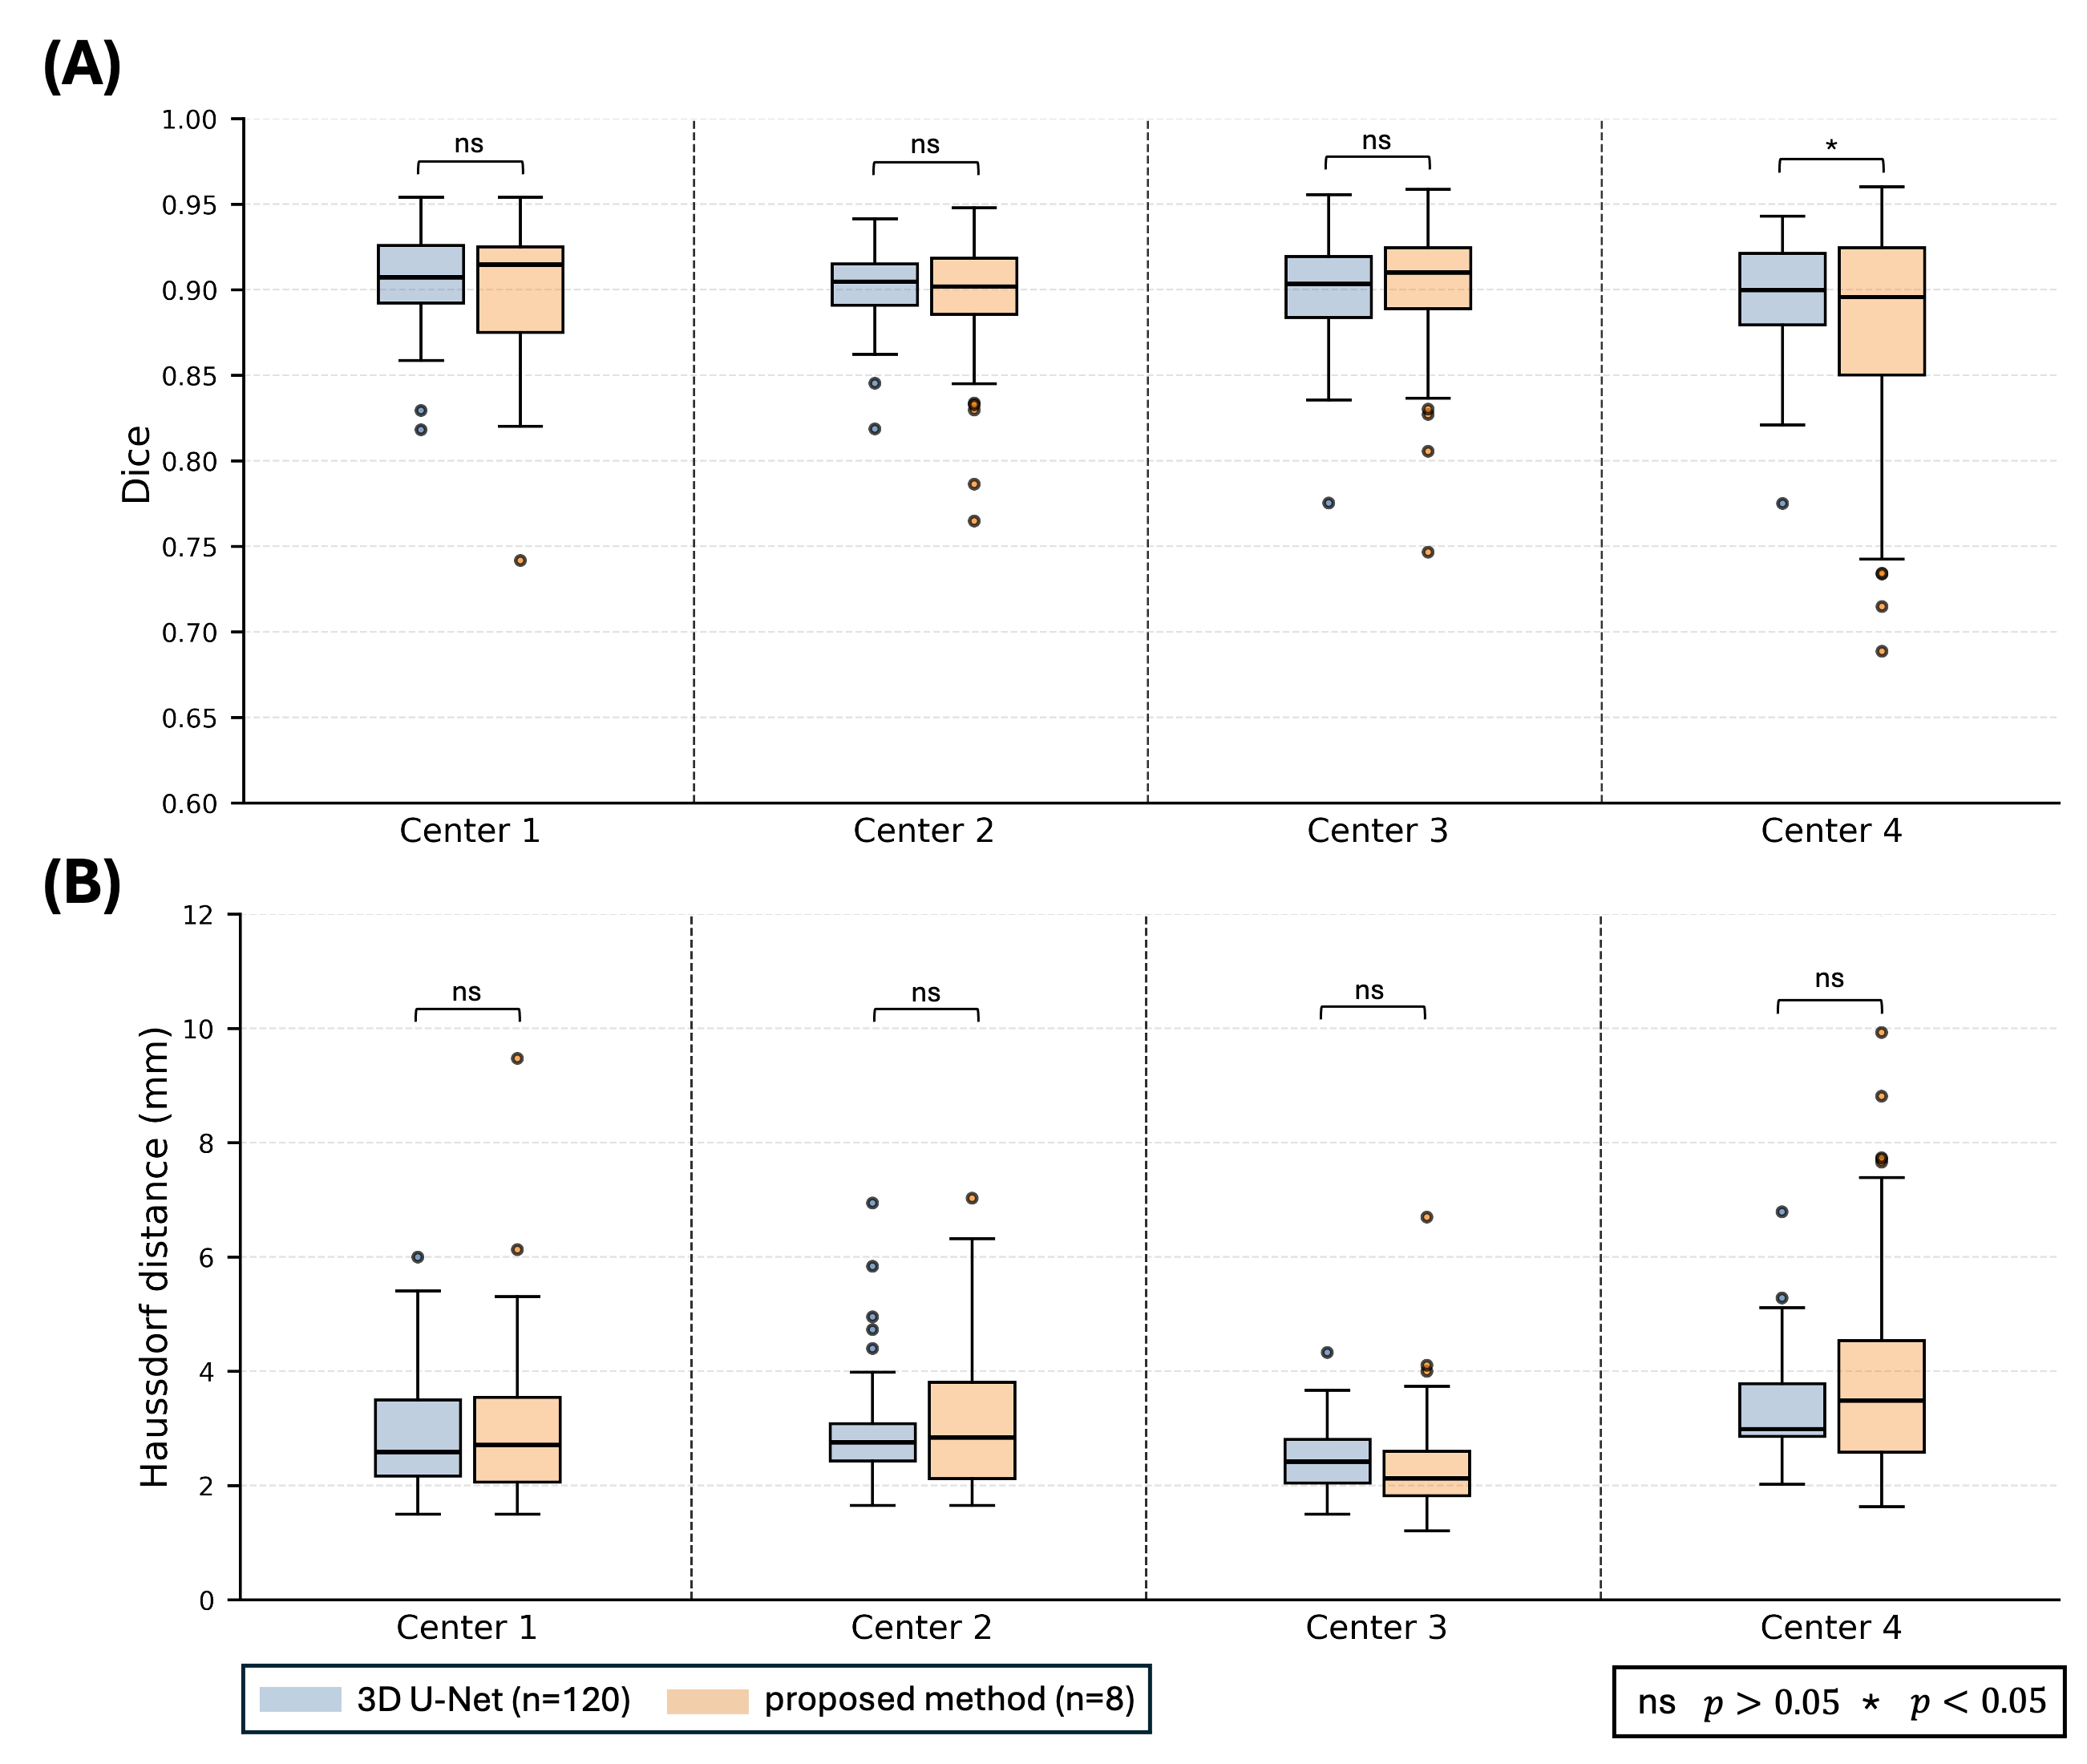
Figure 2: Representative cases from different centers showing the segmentations obtained with the 3D U-Net, the proposed method, and the corresponding manually drawn reference contours. For each center, the columns show (from left to right) the manually drawn contours followed by the automatic segmentations generated with the 3D U-Net and the proposed method, respectively. The number of patients with manual contours each method used for training or fine-tuning is indicated by “n”. Each row shows a different cardiac phase in FPP CMR: left ventricular (LV) enhancement, right ventricular (RV) enhancement, and myocardial enhancement. Dice score between the manual contour and the segmentation generated by the corresponding method is shown in yellow at the bottom-right corner of each perfusion image. The proposed method achieved segmentation accuracy comparable to the 3D U-Net, as reflected by Dice scores, despite being trained with substantially fewer manual contours. Importantly, in specific scenarios, such as the RV and myo. enhancement phase in center 2, it outperformed the 3D U-Net by a considerable margin.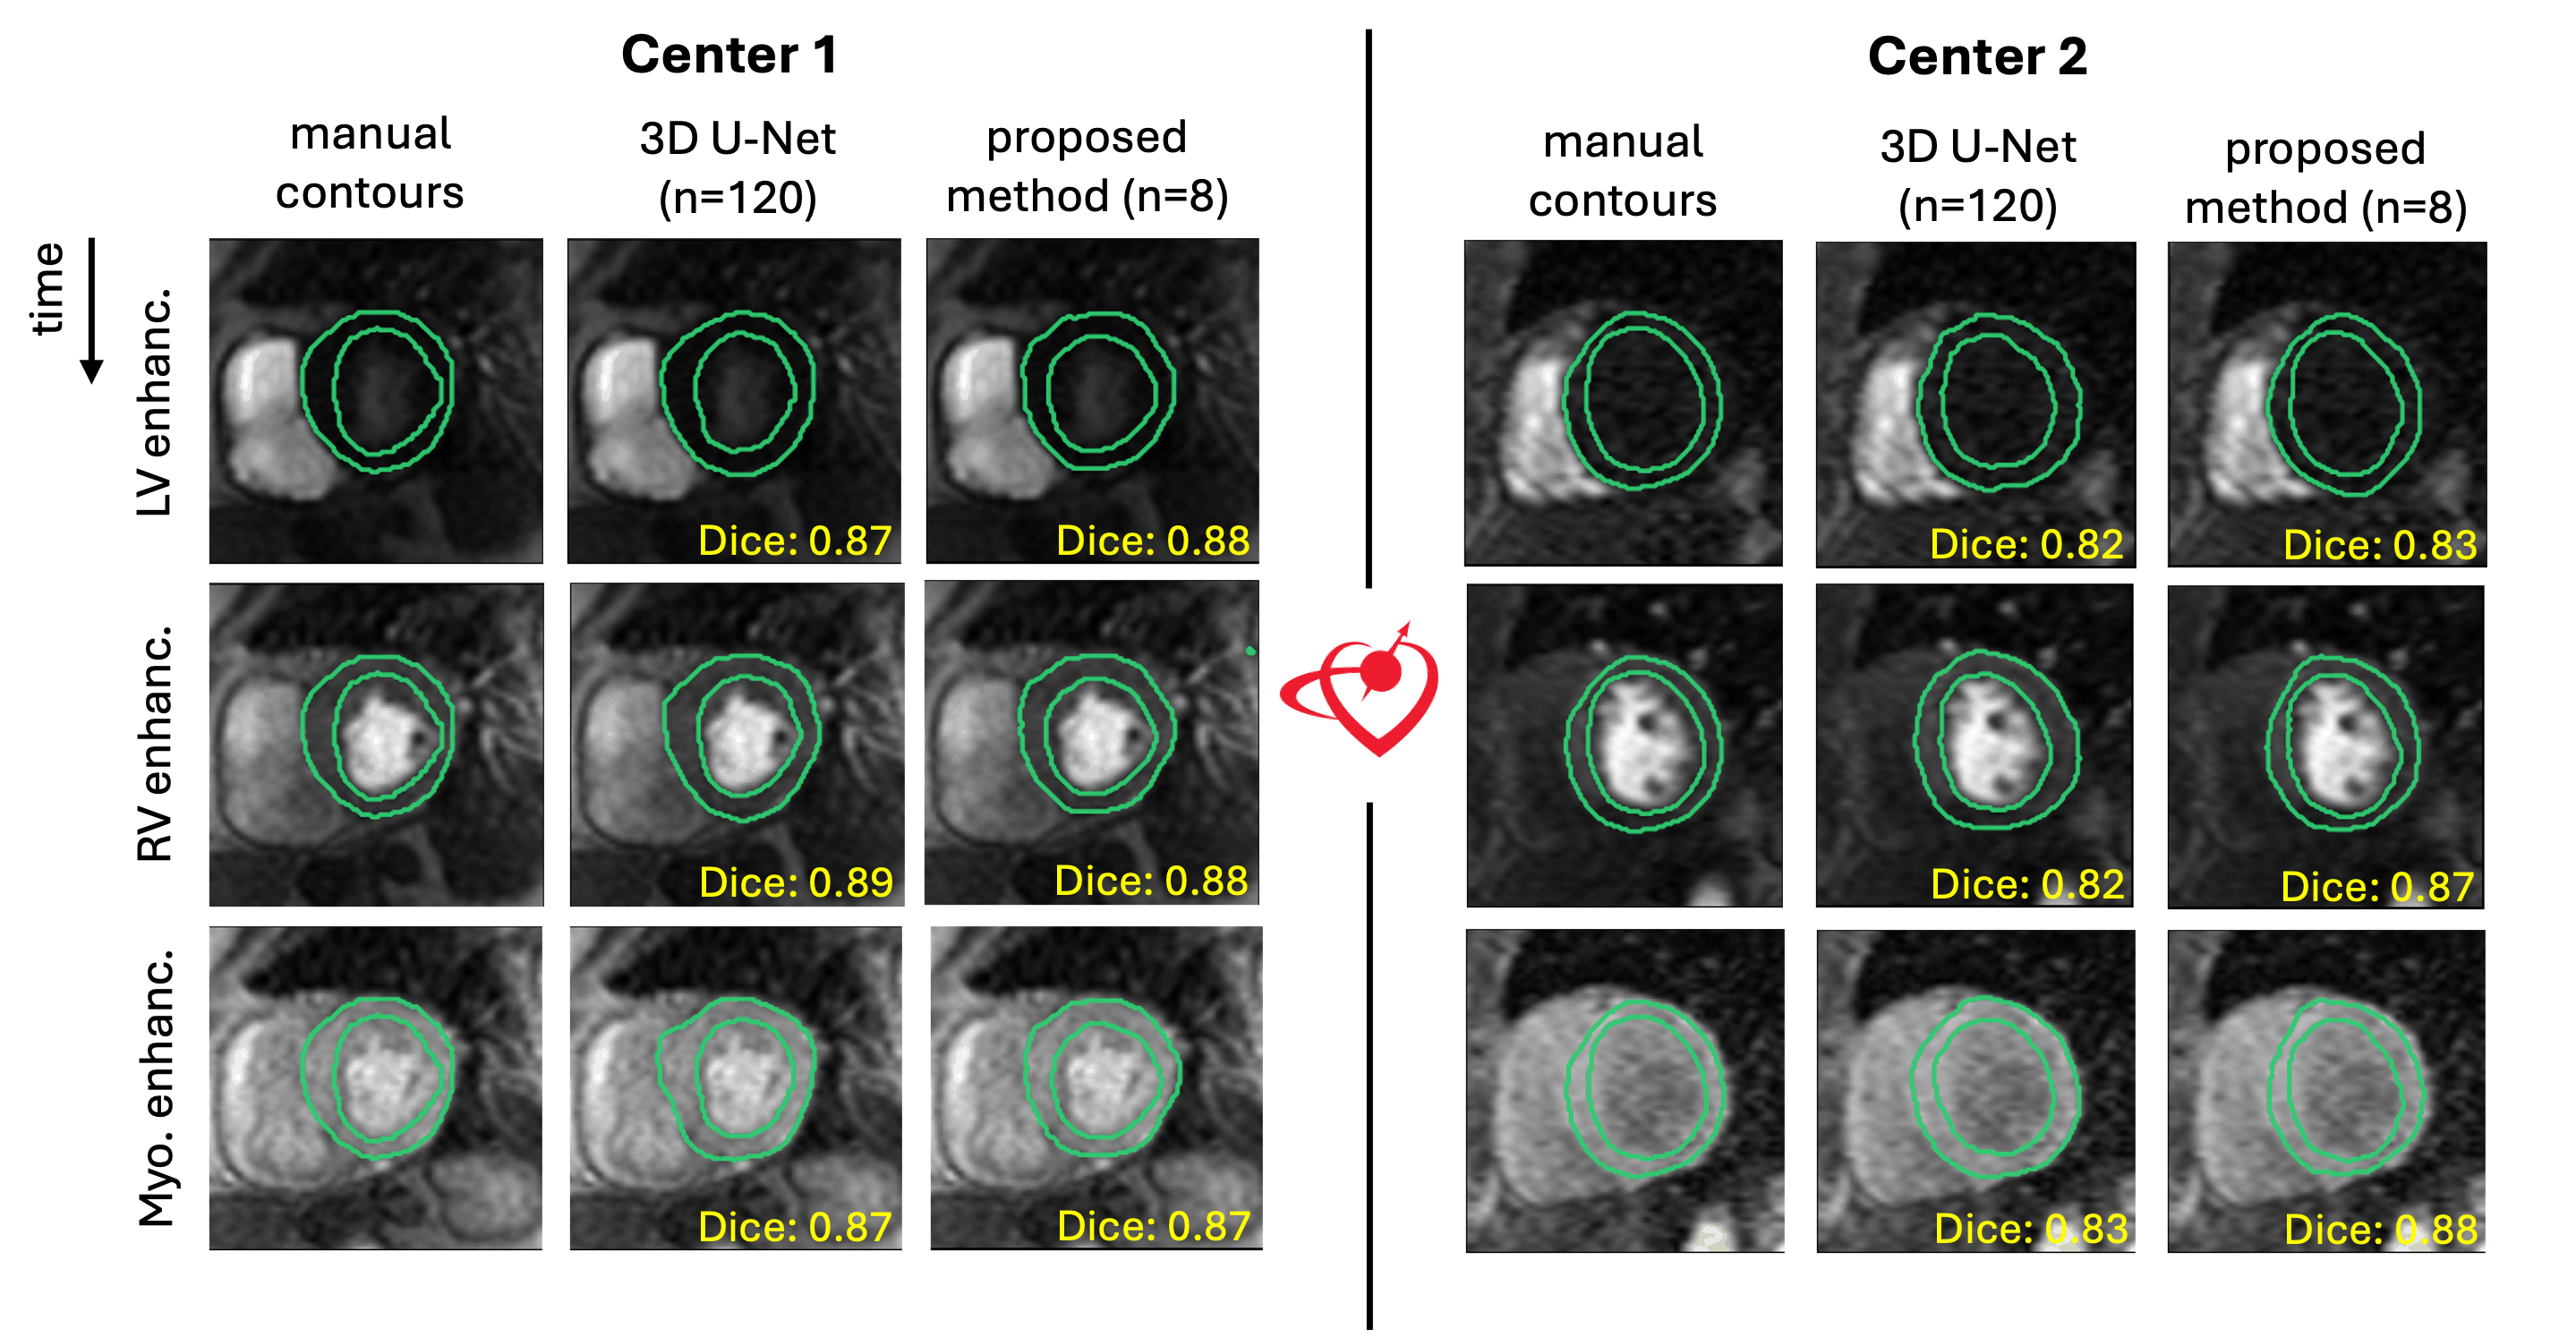 Figure 3: Cumulative first-pass perfusion CMR segmentation results across four centers, evaluated using different metrics. We quantitatively evaluated segmentation performance using Dice score [6], where higher values indicate better overlap, and Hausdorff distance [7], where lower values indicate better boundary agreement. Results for these metrics are shown in panels (A) and (B), respectively. Each panel is divided into four sections, corresponding to box-and-whisker plots for each center. Each box-and-whisker illustrates the segmentation performance of a method, with the method name specified in the legend at the bottom-left of the figure. The number of patients with manually drawn contours used for training each model is indicated by “n”. Statistical significance of the difference between 3D U-Net and the proposed method was calculated using the Student’s t-test. The statistical significance threshold for p value and the corresponding symbols are shown at the bottom-right of the figure. For both segmentation metrics, the difference between the 3D U-Net and the proposed method segmentations were not statistically significant (p > 0.05) at any center except center 4 with Dice score (p < 0.05).