Rapid Fire Session

J. Jane J. Cao, MD, MPH
Director of Translational Research, System director of cardiac imaging
St. Francis Hospital, The Heart Center
Roslyn, New York, United States
J. Jane J. Cao, MD, MPH
Director of Translational Research, System director of cardiac imaging
St. Francis Hospital, The Heart Center
Roslyn, New York, United States
Karli PIpitone, MPH
Research Analyst
St. Francis Hospital & Heart Center
Huntington, New York, United States
Jonathan Weber, MPH
Research Analyst
St. Francis Hospital, The Heart Center
Greenvale, New York, United States
Luis Cardoza
Research Volunteer
St. Francis Hospital, The Heart Center, United States
Jonathan Orozco-Diaz, BSc
Research Associate
St. Francis Hospital & Heart Center
Roslyn, New York, United States
Charles Tarantino
Clinical Research Associate
St. Francis Hospital, The Heart Center, United States
Jacob Stein, BA
Research Associate
St. Francis Hospital & Heart Center
Roslyn, New York, United States
Luke Kenny, BSc
Research Associate
St. Francis Hospital & Heart Center
Roslyn, New York, United States
Nicolette Piscopo
Clinical Research Volunteer
St. Francis Hospital, The Heart Center, United States
Angel (AJ) Salcedo
Clinical Research Scholar
St. Francis Hospital, The Heart Center, United States
Sophia Qiu, BSc
Clinical Scholar
St. Francis Hospital & Heart Center
Roslyn, New York, United States
| PCWP ≤15 mmHg (N=330) | PCWP >15 mmHg (N=778) |
|
Variable | Mean ± SD, N (%) | Mean ± SD, N (%) | p-value* |
Demographics/Past Medical History |
|
|
|
Age (years) | 56 ± 14 | 57 ± 13 | 0.3102 |
BMI (kg/m2) | 26.9 ± 4.8 | 30.2 ± 5.5 | < .0001 |
BSA (m2) | 1.9 ± 0.2 | 2.1 ± 0.3 | < .0001 |
Males | 184 (56) | 575 (74) | < .0001 |
Hypertension | 123 (38) | 383 (50) | 0.0002 |
Diabetes | 57 (18) | 130 (17) | 0.8698 |
Hyperlipidemia | 171 (52) | 395 (52) | 0.8845 |
Smoking | 0.2789 | ||
Current | 14 (4) | 51 (7) |
|
Never | 213 (65) | 474 (62) |
|
Quit | 101 (31) | 240 (31) |
|
Myocardial infarction | 34 (10) | 109 (14) | 0.0802 |
Coronary artery disease | 54 (17) | 147 (19) | 0.2968 |
Stents | 49 (15) | 123 (16) | 0.7383 |
CABG | 13 (4) | 51 (7) | 0.0818 |
Stroke/TIA | 10 (3) | 37 (5) | 0.1806 |
CMR findings |
|
|
|
LAV max (ml/m2) | 29.7 ± 6.9 | 48 ± 18.7 | < .0001 |
LAV min (ml/m2) | 14.5 ± 4.5 | 28.1 ± 17.8 | < .0001 |
LVEDV (ml/m2) | 71.6 ± 16.4 | 93.4 ± 28 | < .0001 |
LVESV (ml/m2) | 33 ± 11.8 | 49.6 ± 28.4 | < .0001 |
LVEF (%) | 54.5 ± 8.1 | 49.6 ± 12.9 | < .0001 |
LV mass (g/m2) | 48.5 ± 9.9 | 65.4 ± 18.5 | < .0001 |
LV stroke volume (ml/m2) | 71.8 ± 16.9 | 90.1 ± 23.1 | < .0001 |
RVEDV (ml/m2) | 65.6 ± 14.6 | 77.6 ± 21.2 | < .0001 |
RVESV (ml/m2) | 29.7 ± 9.0 | 37.1 ± 15.4 | < .0001 |
RVEF (%) | 55.2 ± 7.1 | 53.1 ± 9.7 | 0.0004 |
RV stroke volume (ml/m2) | 67.2 ± 17.0 | 83.8 ± 25.1 | < .0001 |
Delayed enhancement | 111 (34) | 409 (53) | < .0001 |
Regional wall motion abnormalities | 64 (19) | 276 (36) | < .0001 |
CMR PCWP | 13.6 ± 1.0 | 18.9 ± 3.7 | < .0001 |
*P-values were calculated using Student's t-test for continuous variables and chi-square for categorical variablesTable 2. Likelihood ratio testing adding CMR PCWP group (≤15 vs. <15 mmHg)
Model* predicting composite outcome | AUC (95% LL, UL) | LR | p-value |
Model 1 | 0.67 (0.63, 0.72) | Reference | |
Model 1 + CMR PCWP** | 0.73 (0.68, 0.77) | 32.61 | < .0001 |
Model 1 + LVEF | 0.77 (0.73, 0.81) | Reference | |
Model 1 + LVEF + CMR PCWP | 0.79 (0.75, 0.82) | 19.07 | < .0001 |
Model 1 + RVEF | 0.71 (0.67, 0.76) | Reference | |
Model 1 + RVEF + CMR PCWP | 0.75 (0.71, 0.79) | 30.53 | < .0001 |
Model 1 + LVEDVI | 0.73 (0.69, 0.77) | Reference | |
Model 1 + LVEDVI + CMR PCWP | 0.75 (0.71, 0.79) | 15.35 | < .0001 |
Model 1 + LVESVI | 0.76 (0.72, 0.80) | Reference | |
Model 1 + LVESVI + CMR PCWP | 0.78 (0.74, 0.81) | 15.57 | < .0001 |
Model 1 + RVEDVI | 0.67 (0.63, 0.72) | Reference | |
Model 1 + RVEDVI + CMR PCWP | 0.73 (0.68, 0.77) | 36.36 | < .0001 |
Model 1 + RVESVI | 0.68 (0.64, 0.73) | Reference | |
Model 1 + RVESVI + CMR PCWP | 0.73 (0.69, 0.77) | 28.86 | < .0001 |
Model 1 + LV stroke volume | 0.70 (0.66, 0.75) | Reference | |
Model 1 + LV stroke volume + CMR PCWP | 0.76 (0.72, 0.80) | 47.38 | < .0001 |
Model 1 + RV stroke volume | 0.72 (0.67, 0.76) | Reference | |
Model 1 + RV stroke volume + CMR PCWP | 0.77 (0.73, 0.81) | 48.42 | < .0001 |
Model 1 + LGE | 0.69 (0.64, 0.73) | Reference | |
Model 1 + LGE + CMR PCWP group | 0.73 (0.69, 0.77) | 30.01 | < .0001 |
*Model adjusted for age, gender, BSA, hypertension, diabetes, and CAD
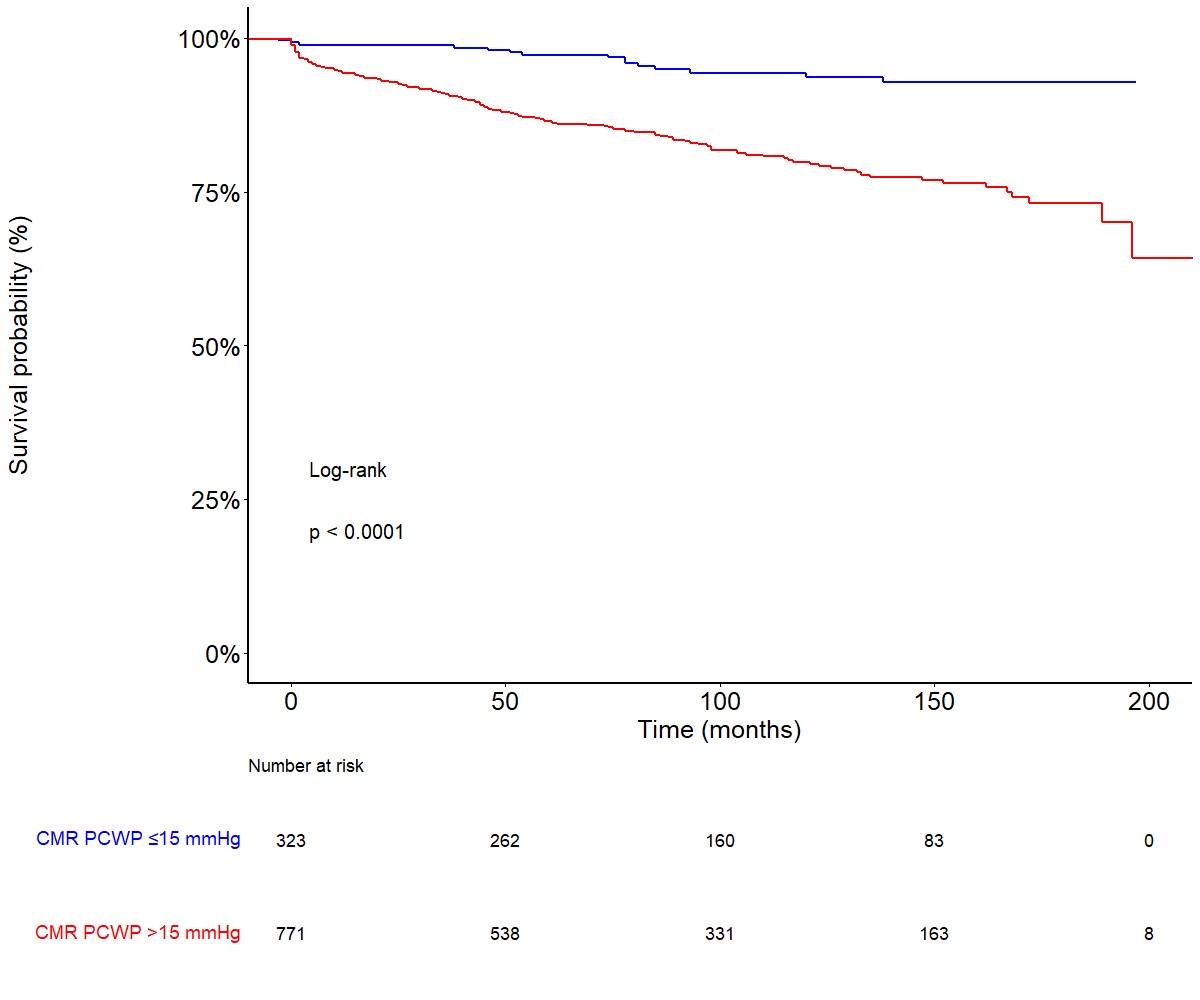
** CMR PCWP ≤15 vs. < 15 mmHgFigure. Kaplan-Meier curve of composite outcome stratified by CMR PCWP group (≤15 vs. <15 mmHg)