Rapid Fire Session
.jpg "David Ian Paterson, MD, FSCMR photo")
David Ian Paterson, MD, FSCMR
Director of Cardiac Imaging
University of Ottawa Heart Institute
Ottawa, Ontario, Canada
David Ian Paterson, MD, FSCMR
Director of Cardiac Imaging
University of Ottawa Heart Institute
Ottawa, Ontario, Canada
Mihir Kamra
medical student
University of Ottawa, Canada
Daniella Briones-Garcia
student
University of Ottawa, Canada
Rebecca E. Thornhill, PhD
Professor
University of Ottawa, Ontario, Canada
Richard Thompson, PhD
Professor
University of Alberta
Edmonton, Alberta, Canada
Variable | Readmit < =180d | No readmit < =180d | P value |
BNP Value | 9.39e+03 [1.26e+04] | 3.78e+03 [3.68e+03] | 0.004847 |
Follow-up BNP | 3.52e+03 [1.69e+03] | 851 [1.12e+03] | 0.008582 |
Indexed LVEDV (ml/m2) | 149 [73.7] | 92.8 [68.9] | 0.02541 |
Total Lung Water Fraction (%) | 35.2 [6.21] | 30.9 [7.53] | 0.06715 |
Myocardial T1 (ms) | 1.06e+03 [31.5] | 1.03e+03 [94] | 0.09937 |
Indexed LV mass (g/m2) | 76.9 [23.1] | 63.3 [30.3] | 0.2377 |
T1 Liver | 653 [35.5] | 636 [156] | 0.2887 |
LVEF (%) | 18.6 [12.5] | 23.7 [28] | 0.3485 |
Abs diff in lung water % | 2.29 [10.2] | 2.05 [3.4] | 0.3551 |
Total Lung Volume (mL) | 1.95e+03 [695] | 2.3e+03 [633] | 0.4098 |
BNP reduction | 17.3 [45.8] | 63 [37.7] | 0.495 |
Total Lung Water (mL) | 655 [130] | 647 [231] | 0.5294 |
Total Vascular Water Volume (mL) | 146 [38.6] | 129 [49.4] | 0.5294 |
Follow-up Total Lung Volume (mL) | 2.4e+03 [853] | 2.33e+03 [867] | 0.5327 |
Follow-up Total Lung Water (mL) | 638 [245] | 673 [279] | 0.7897 |
Follow-up Total Vascular Water Volume (mL) | 130 [43.8] | 129 [68.5] | 0.8358 |
Follow-up Total Lung Water Fraction (%) | 30.3 [6.99] | 29.7 [6.89] | 0.9292 |
| |
Age | 66.5±14 |
Male Sex | 29 (67.4%) |
Body Mass Index, kg/m2 | 30.2±5.9 |
Systolic Blood Pressure, mmHg | 127±24 |
Heart Rate, /min | 92±29 |
Respiratory Rate | 21±4 |
Prior CHF | 29 |
Atrial Fibrillation | 23 |
Coronary Artery Disease | 16 |
Chronic Obstructive Lung Disease | 6 |
NT-proBNP, ng/L | 6929±8635 |
Creatinine, um/L | 123±59 |
Hemoglobin, g/L | 132±22 |
LVEF, % | 28±16 |
Indexed LV mass, g/m2 | 70±21 |
Indexed LVEDV, ml/m2 | 114±56 |
Myocardial T1, ms | 1005±139 |
Hepatic T1, ms | 656±121 |
Lung water density, % | 32.5±7.4 |
.jpg) Figure 2. Correlation of Admission NT-proBNP and Lung Water Density
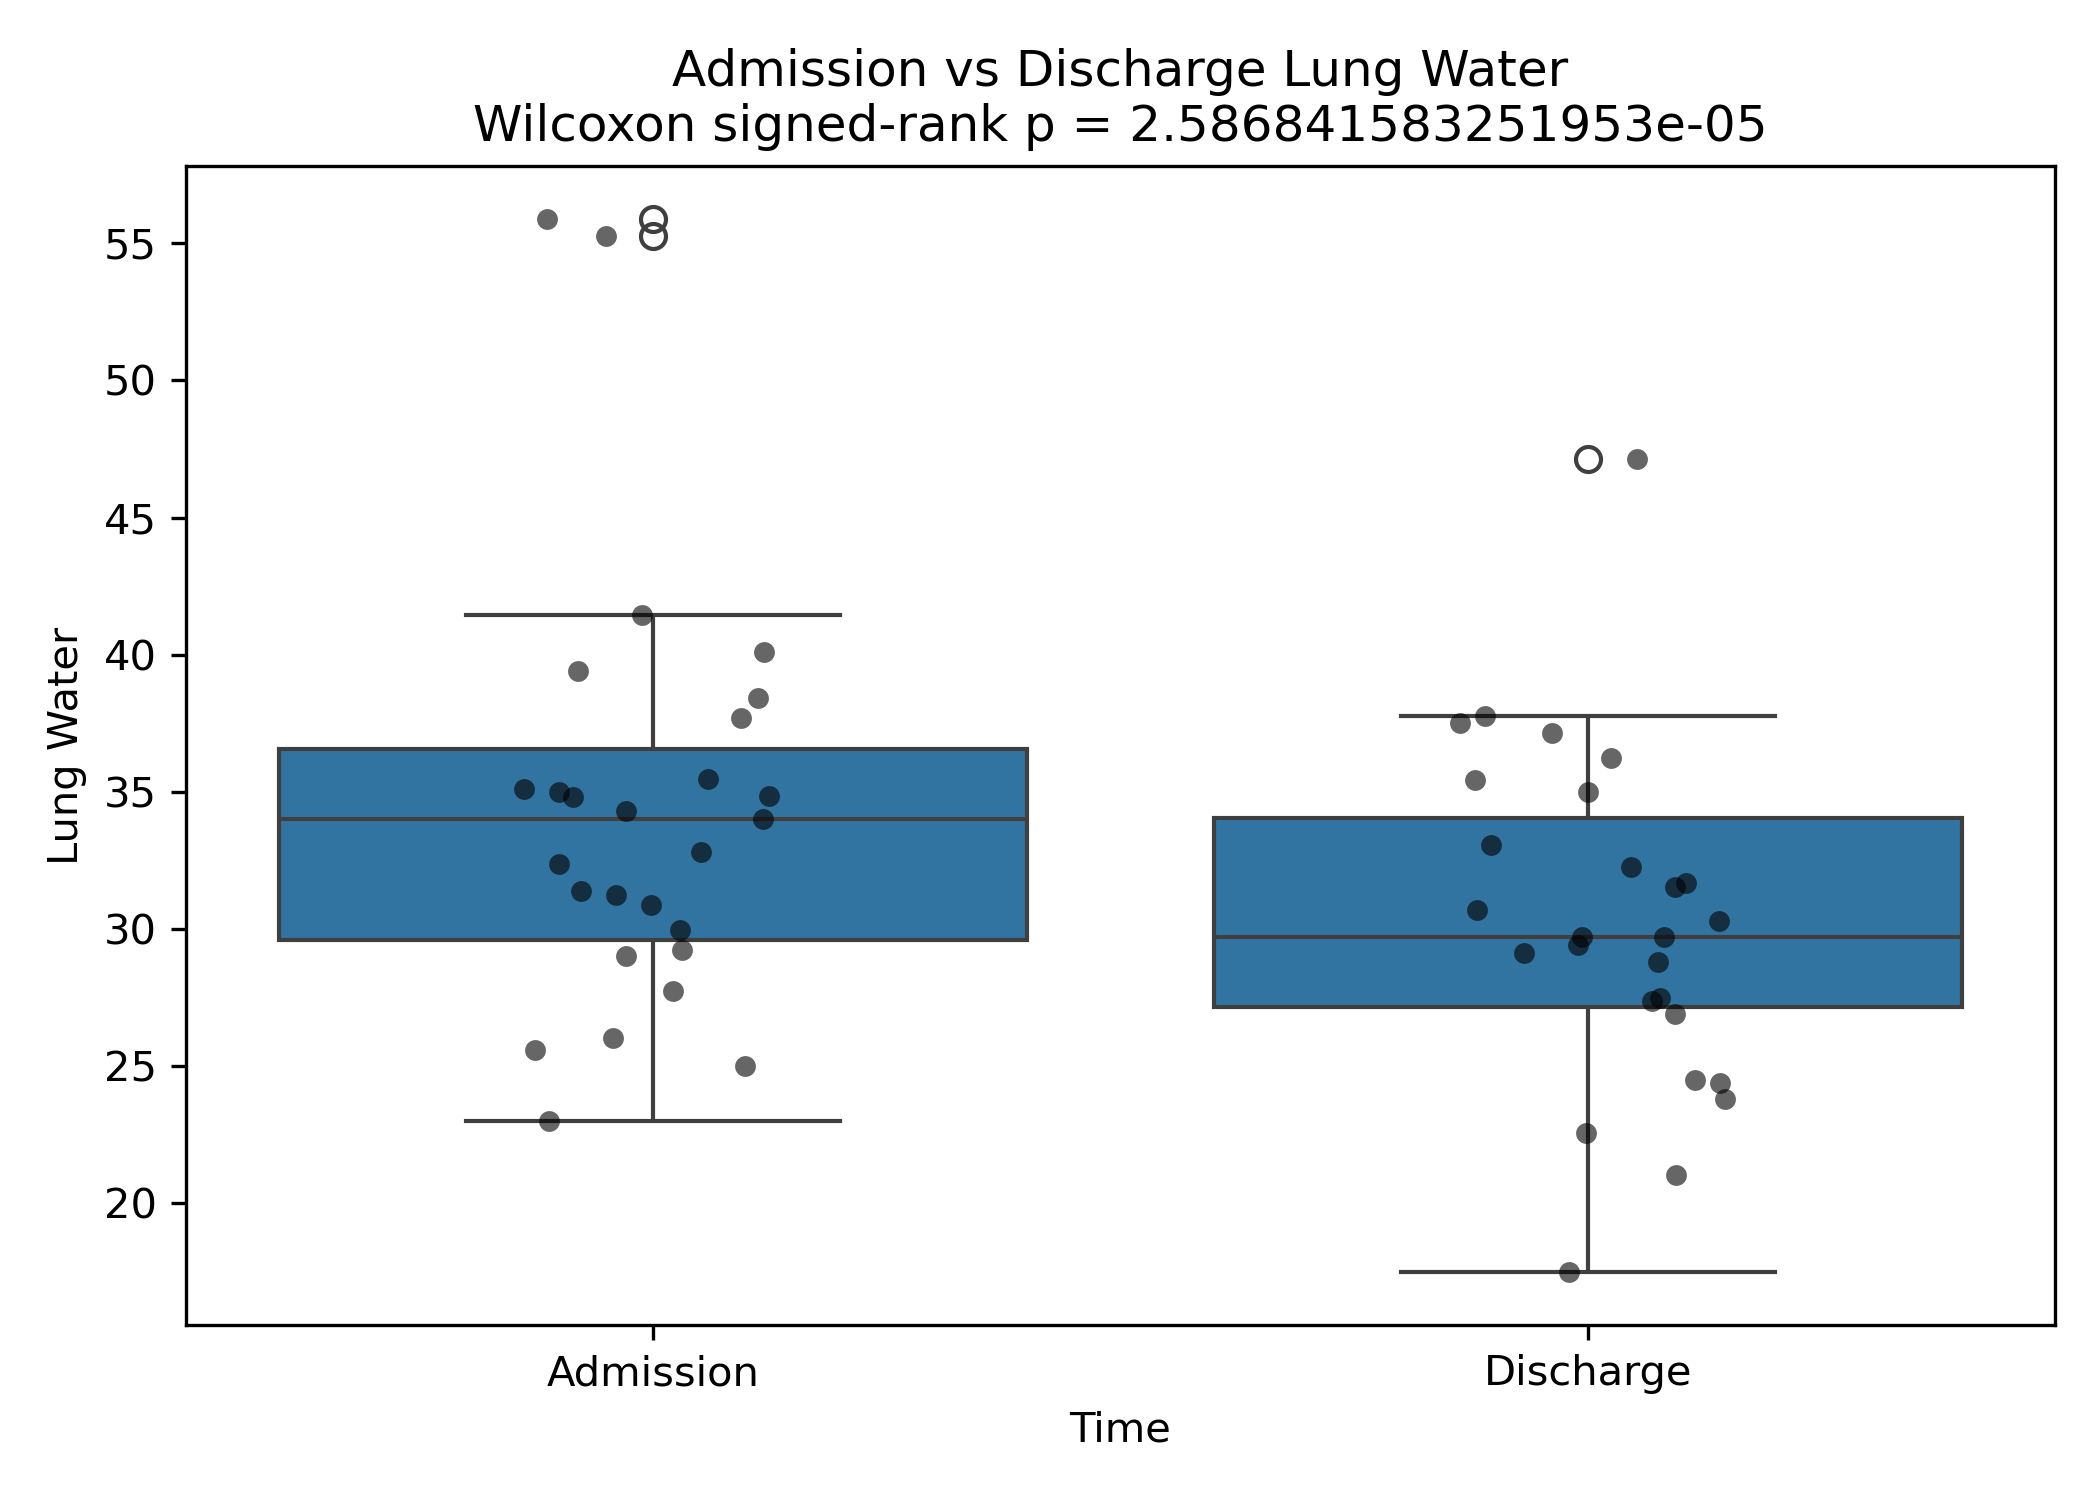
Figure 2. Correlation of Admission NT-proBNP and Lung Water Density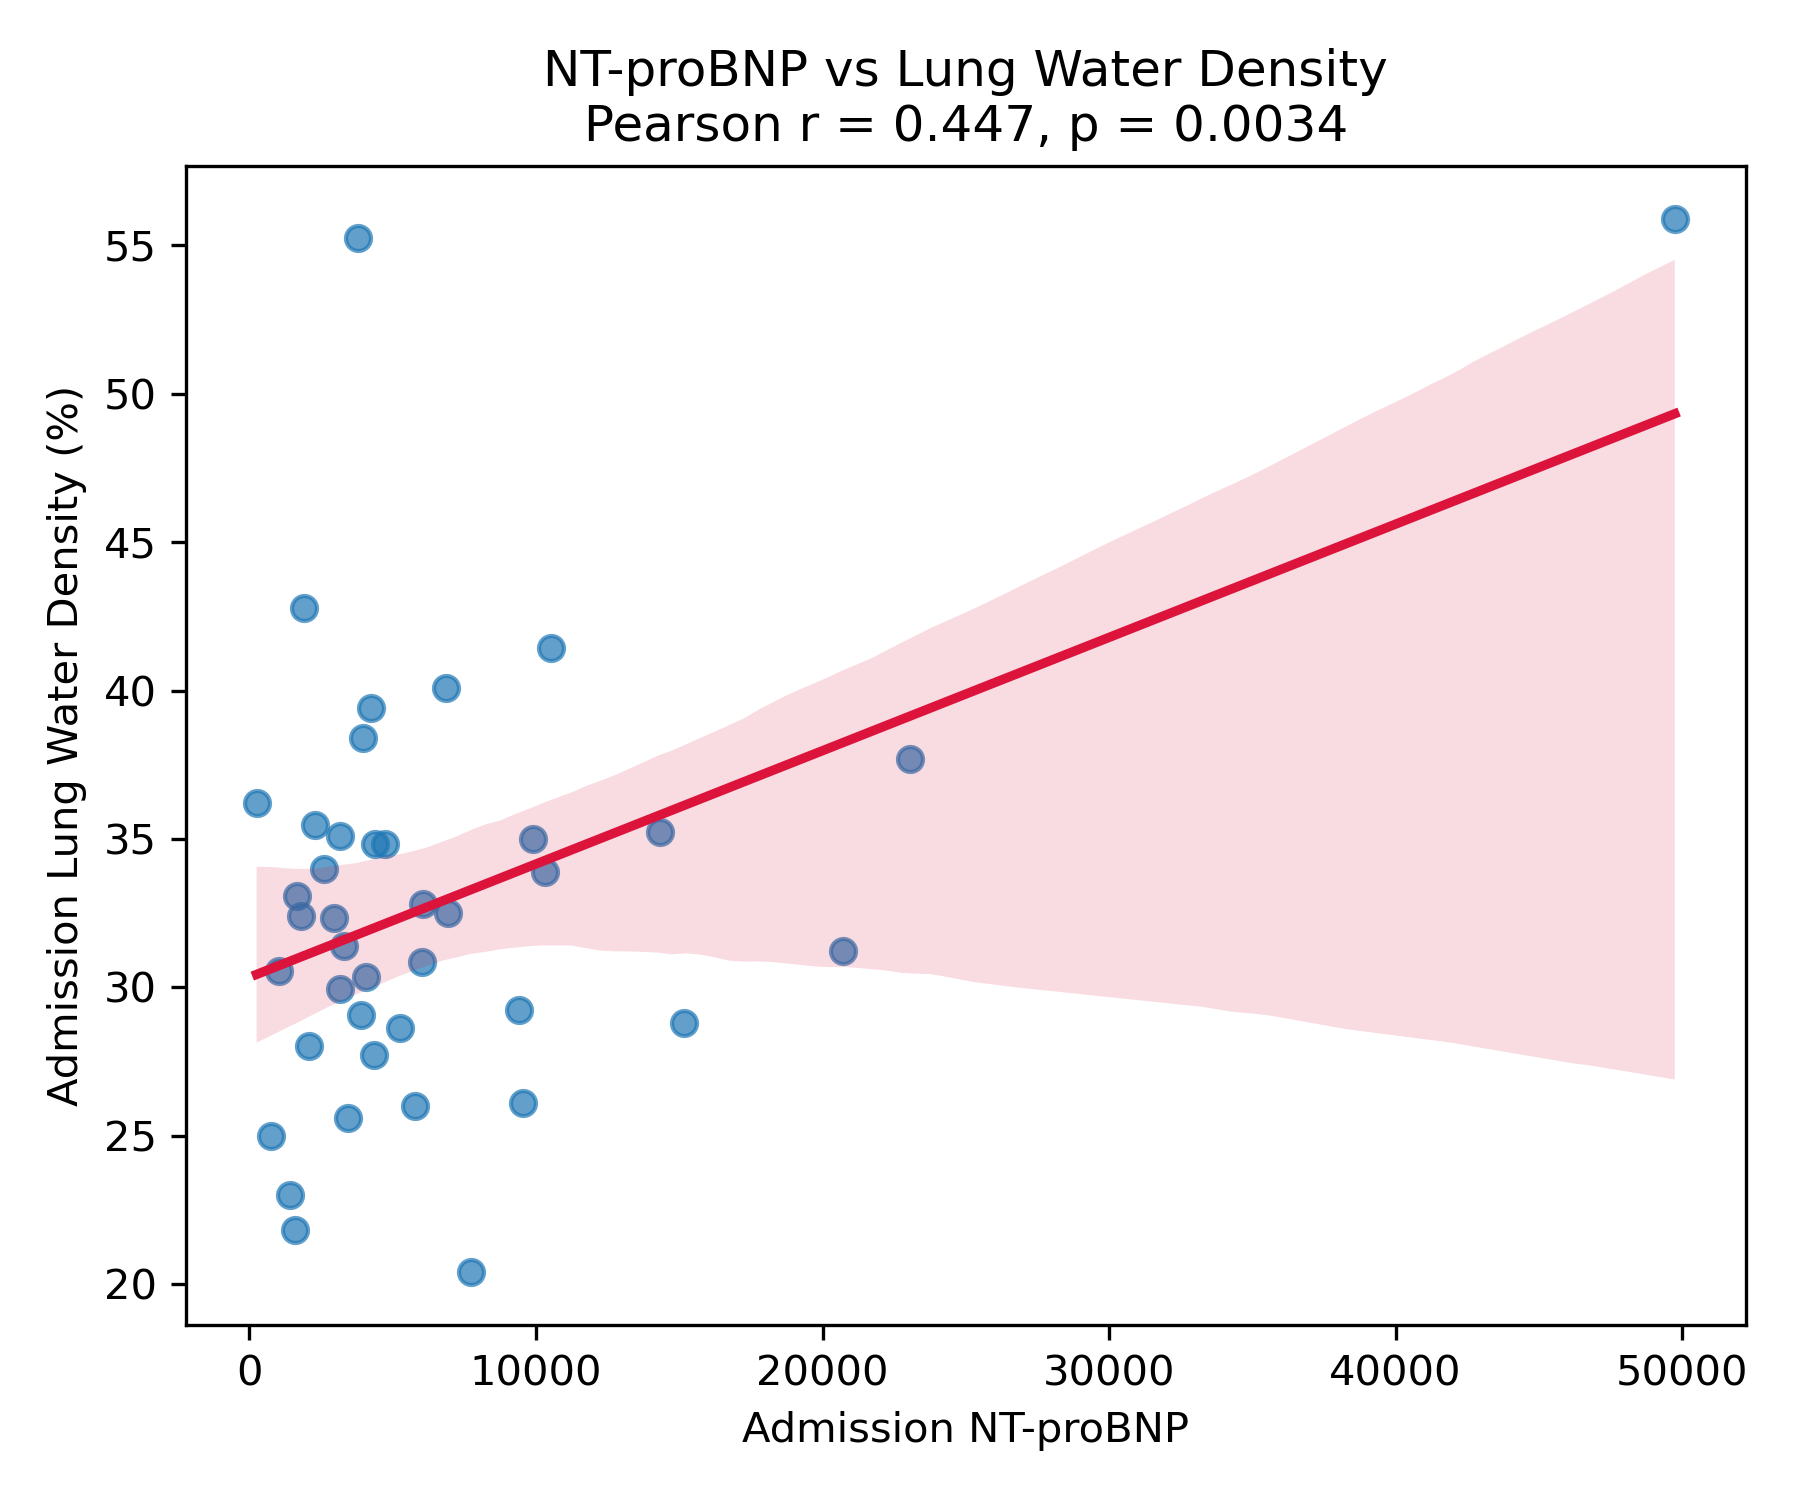 Figure 3. Comparison Between Admission and Discharge Lung Water Density