Oral Abstracts Session
Virtual Recording
Erik Hedström, MD, PhD
Adjunct professor
Lund University and Skåne University Hospital, Lund
Lund, Skane Lan, Sweden
Karin Pola, MD
MD, PhD student
Lund University, Skåne University Hospital Lund, Department of Clinical Sciences Lund, Clinical Physiology, Lund, Sweden
Lund, Skane Lan, Sweden
Katarina Steding-Ehrenborg, PhD
RPT, PhD
Lund University and Skåne University Hospital, Lund, Sweden
Lund, Skane Lan, Sweden
Camilla Edvinsson, MD, PhD
Researcher
Helsingborg Hospital, Lund University, Sweden
Stefan R. Hansson, MD
Professor
Lund University, Sweden
Per M Arvidsson, MD, PhD
Postdoctoral researcher
Lund University
Lund, Skane Lan, Sweden
Erik Hedström, MD, PhD
Adjunct professor
Lund University and Skåne University Hospital, Lund
Lund, Skane Lan, Sweden
| Preeclampsia (n=8) | Controls (n=9) | Active (n=9) | p-value Controls | p-value Active |
Age (years) | 42 [35 – 48] | 39 [37 – 43] | 36 [34-42] | 0.7 | 0.4 |
Time since index pregnancy (years) | 6 [5 – 7] | 6 [5 – 7] | 5 [4 – 6] | 1 | 0.1 |
Heart rate (bpm) | 63 [60 – 71] | 59 [52-62] | 1 | 0.06 | |
LVM (g) | 73 [63-83] | 78 [65-85] | 81 [72-86] | 0.7 | 0.1 |
EDV (mL) | 148 [139 – 174] | 160 [131 – 174] | 181 [167-194] | 0.7 | 0.02 |
ESV (mL) | 57 [49 – 68] | 60 [55 – 78] | 73 [69-85] | 0.5 | 0.02 |
SV (mL) | 92 [86 – 95] | 94 [76 – 96] | 107 [97-117] | 1 | 0.02 |
Cardiac output (L/min) | 5.6 [5.0 – 6.3] | 5.7 [4.8 – 6.4] | 6.1 [5.3-7.1] | 0.8 | 0.4 |
Ejection fraction (%) | 61 [58 – 63] | 57 [54 – 61] | 59 [57-62] | 0.2 | 0.4 |
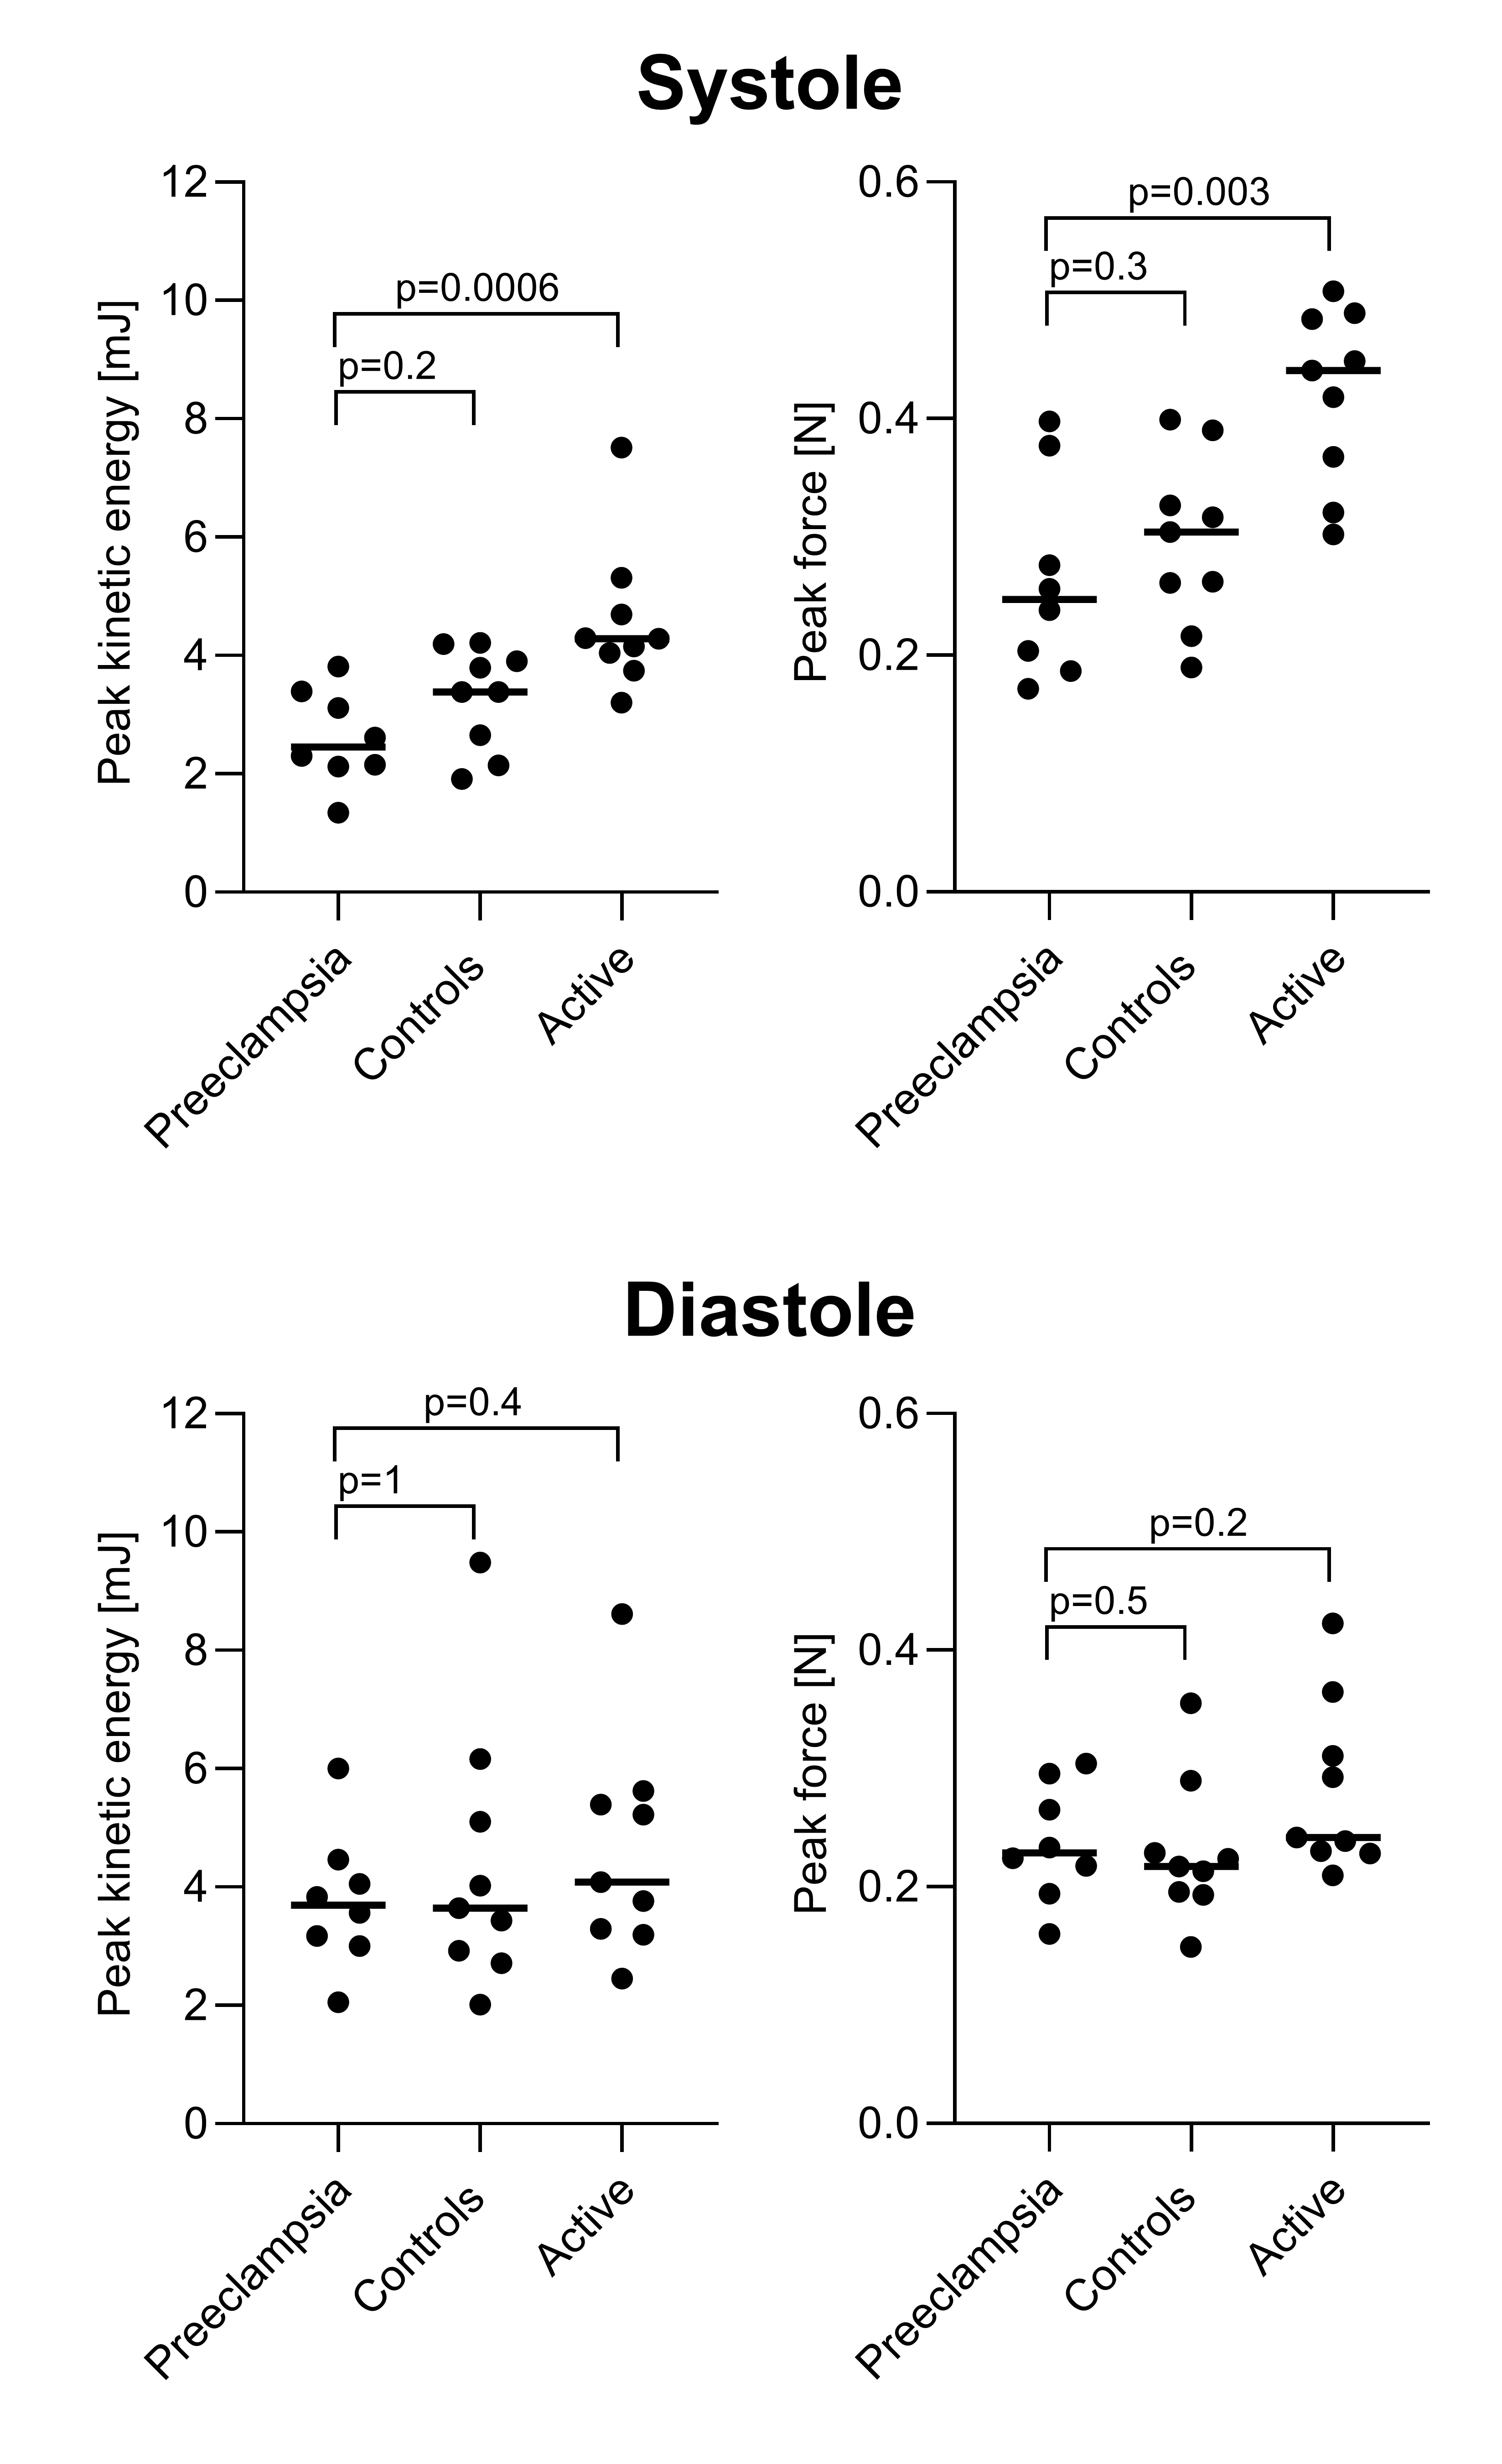
Data are presented as median [IQR; interquartile range]. P-values for comparisons between the Preeclampsia group and Controls, or between the Preeclampsia group and Active. bpm, beats per minute; LVM, left ventricular mass; EDV, end-diastolic volume; ESV, end-systolic volume; SV, stroke volume.Kinetic energy (top) and hemodynamic forces in the apex-base direction (bottom) over the cardiac cycle in women with prior preeclampsia (left), controls (middle) and women following the WHO recommendations for physical activity (Active) (right). All three groups exhibit similar patterns in kinetic energy and forces, but the Active group shows higher systolic peaks.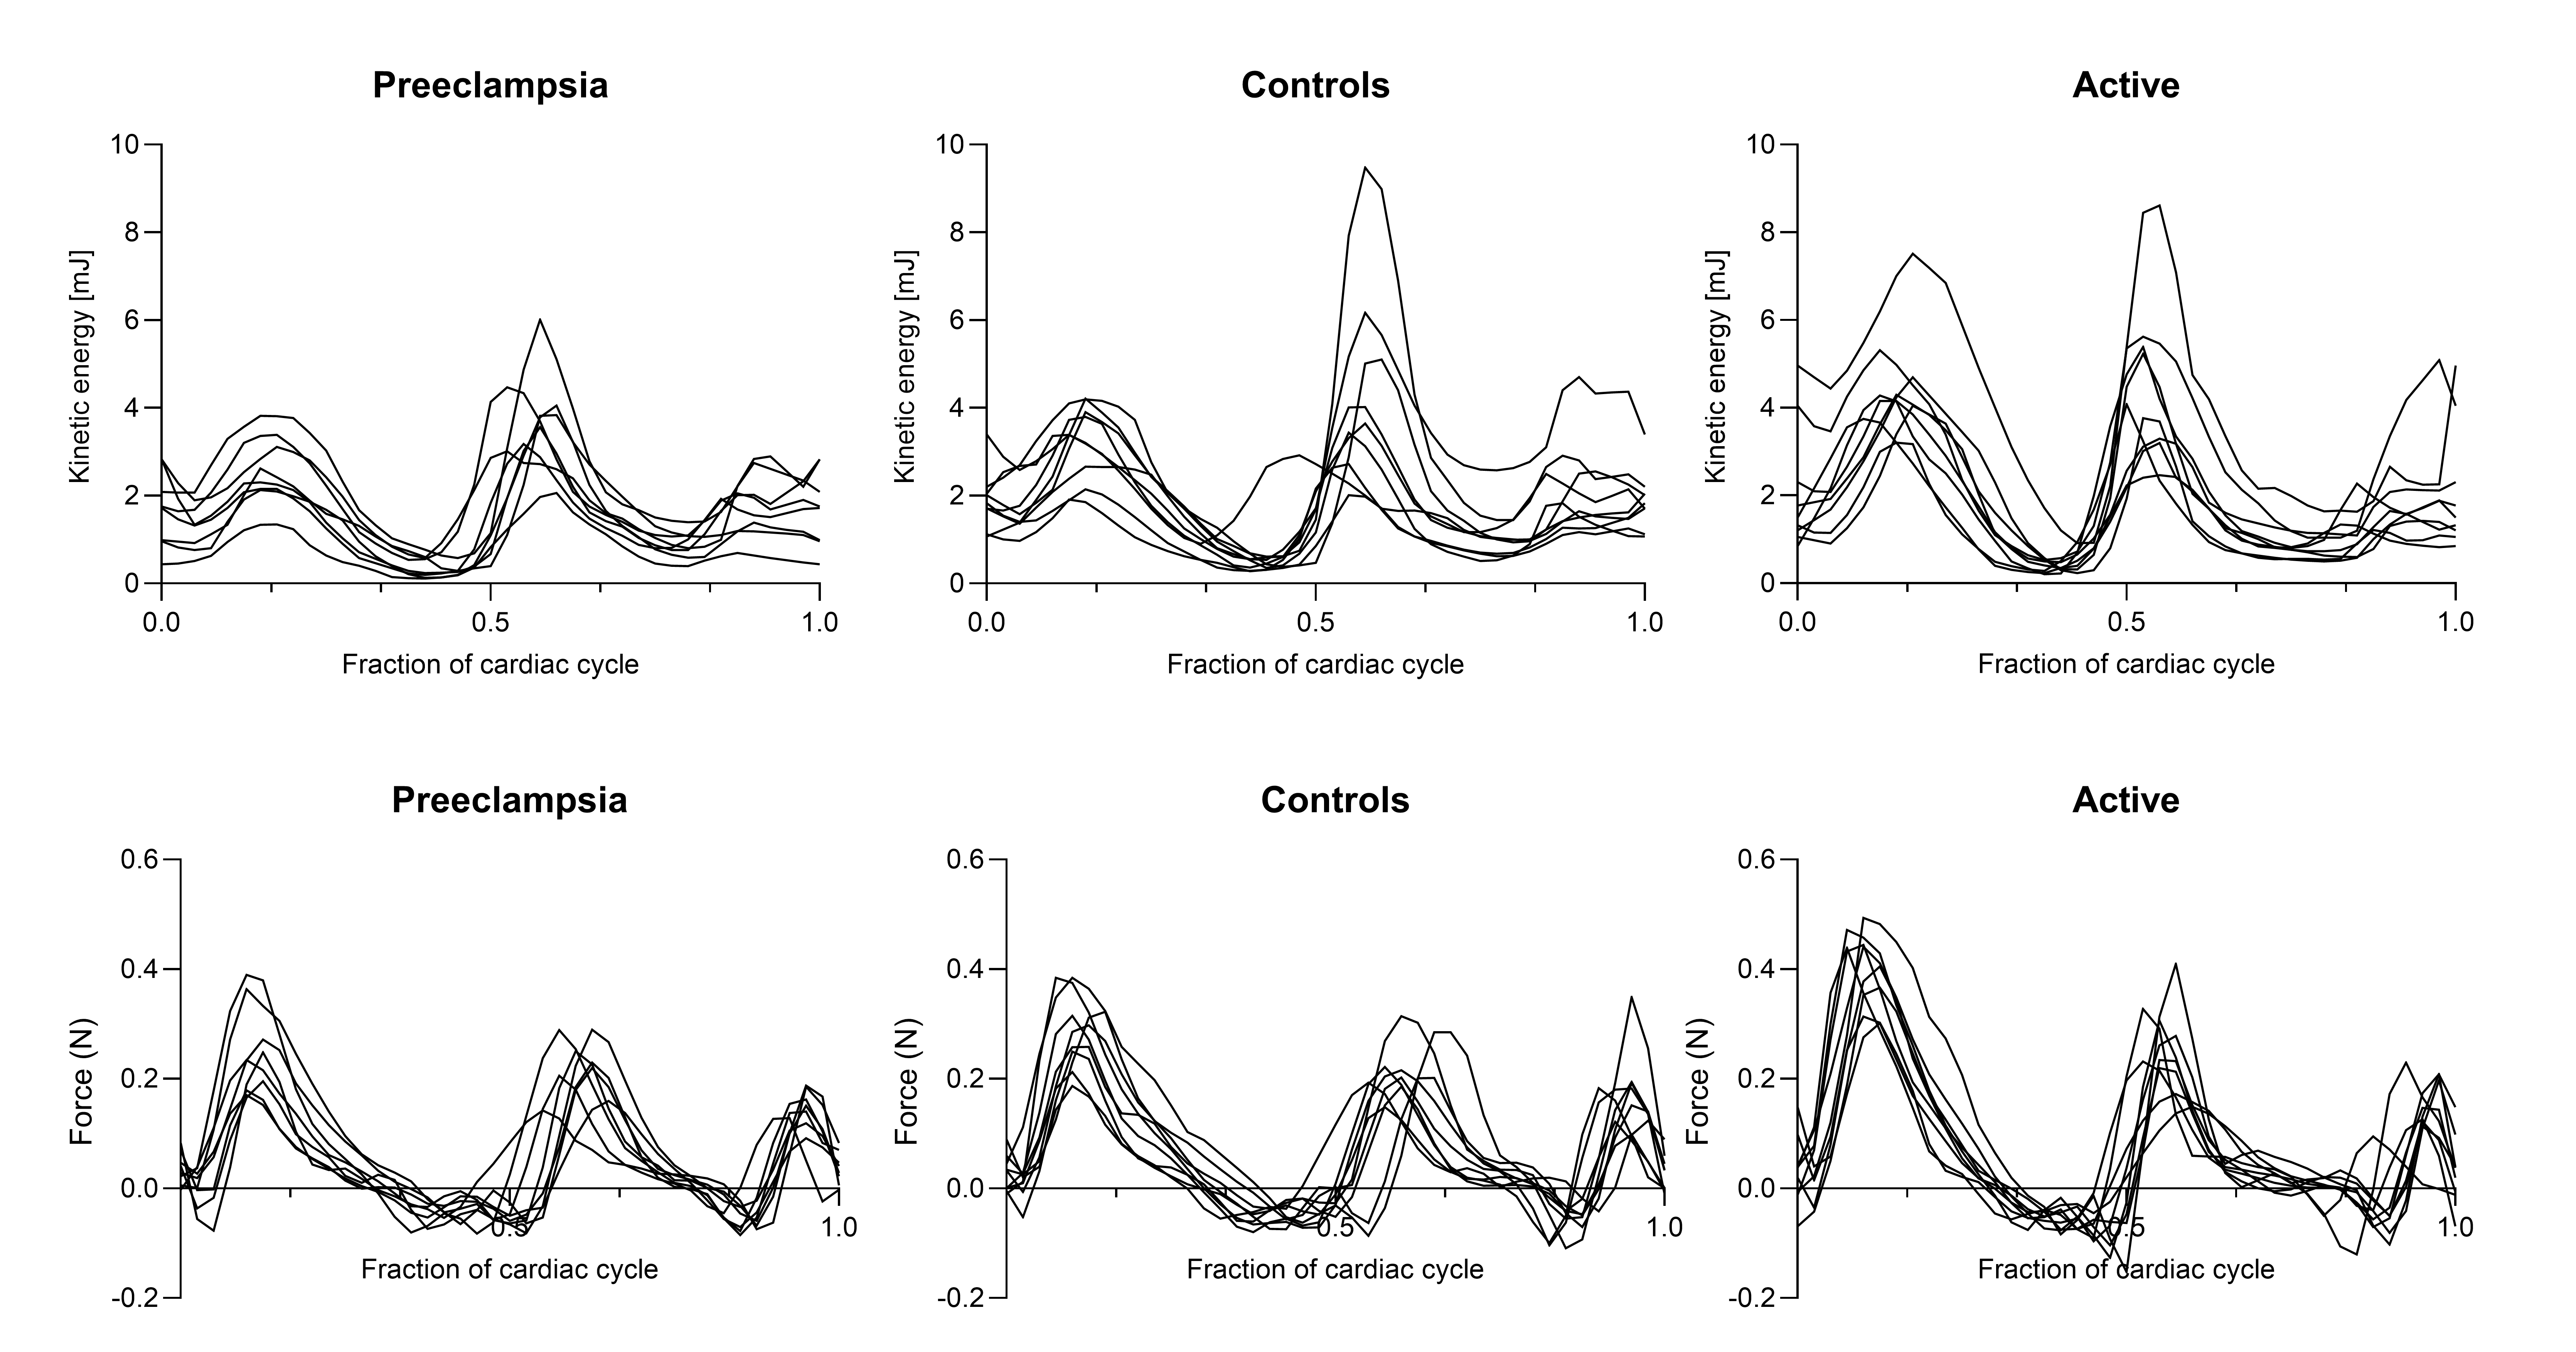 Peak kinetic energy and hemodynamic forces in the apex-base direction in systole (top) and diastole (bottom) in women with prior preeclampsia, controls, and women following the WHO recommendations for physical activity (Active). In systole, both kinetic energy and forces exhibit patterns of increasing peaks from preeclampsia, to controls, to the active group.