Oral Abstracts Session

Hazar Benan Unal, PhD
Postdoctoral Research Associate
Laboratory for Translational Imaging of Microcirculation, Purdue University
Indianapolis, Indiana, United States
Hazar Benan Unal, PhD
Postdoctoral Research Associate
Laboratory for Translational Imaging of Microcirculation, Purdue University
Indianapolis, Indiana, United States
Shahriar Zeynali, MSc
PhD Candidate
Indiana University School of Medicine
Indianapolis, Indiana, United States
Eric Anttila, PhD
Research Engineer
MED Institute, United States

Rohan Dharmakumar, PhD
Executive Director
Indiana University School of Medicine
Indianapolis, Indiana, United States

David Gross, PhD
Director of MRI Safety Evaluations and Engineering Simulations
MED Institute
West Lafayette, Indiana, United States
Behzad Sharif, PhD
Associate Professor
Purdue University
Indianapolis, Indiana, United States
 Figure 2: Overview of in vivo findings comparing myocardial and blood T1 sensitivity across all subjects (0.55T: n = 23; 3T: n = 18). Each point represents T1 sensitivity at different ferumoxytol doses, with two doses per animal (in addition to the native baseline). (a) Myocardial T1 sensitivity exhibited a linear dose-dependent increase at both field strengths, with 0.55T (red) showing a significantly steeper slope—over twice that of 3T (blue) (p < 0.01). (b) Blood T1 sensitivity followed an exponential trend with dose at both field strengths, and again, 0.55T demonstrated markedly higher sensitivity than 3T for equivalent doses (p < 0.01).
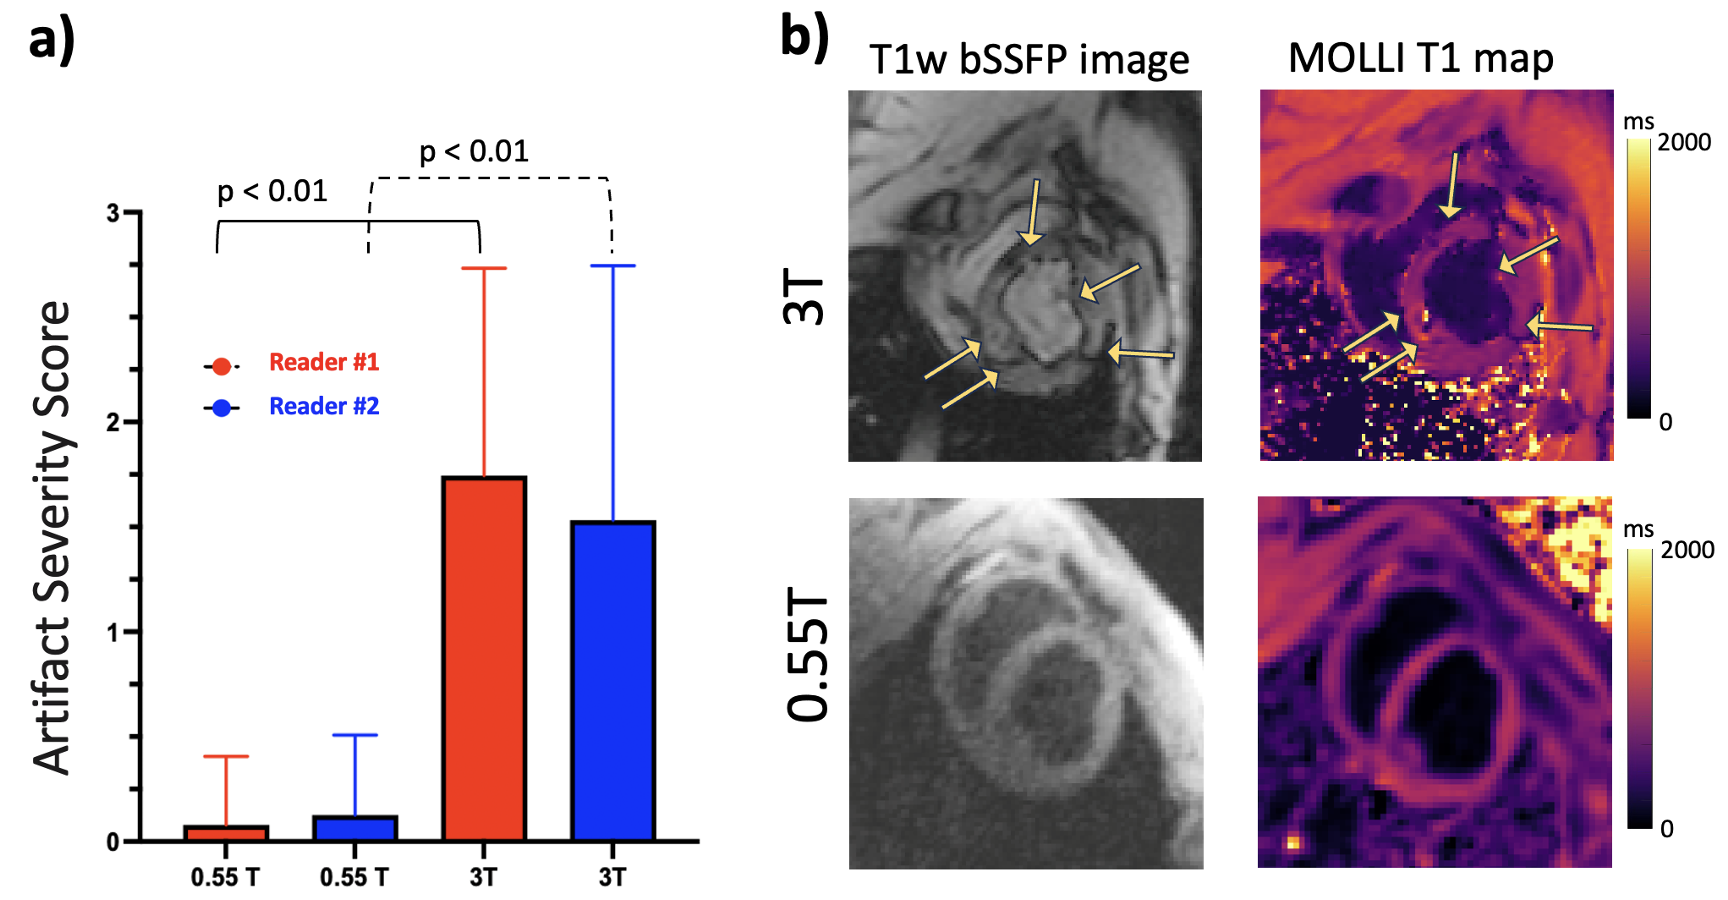
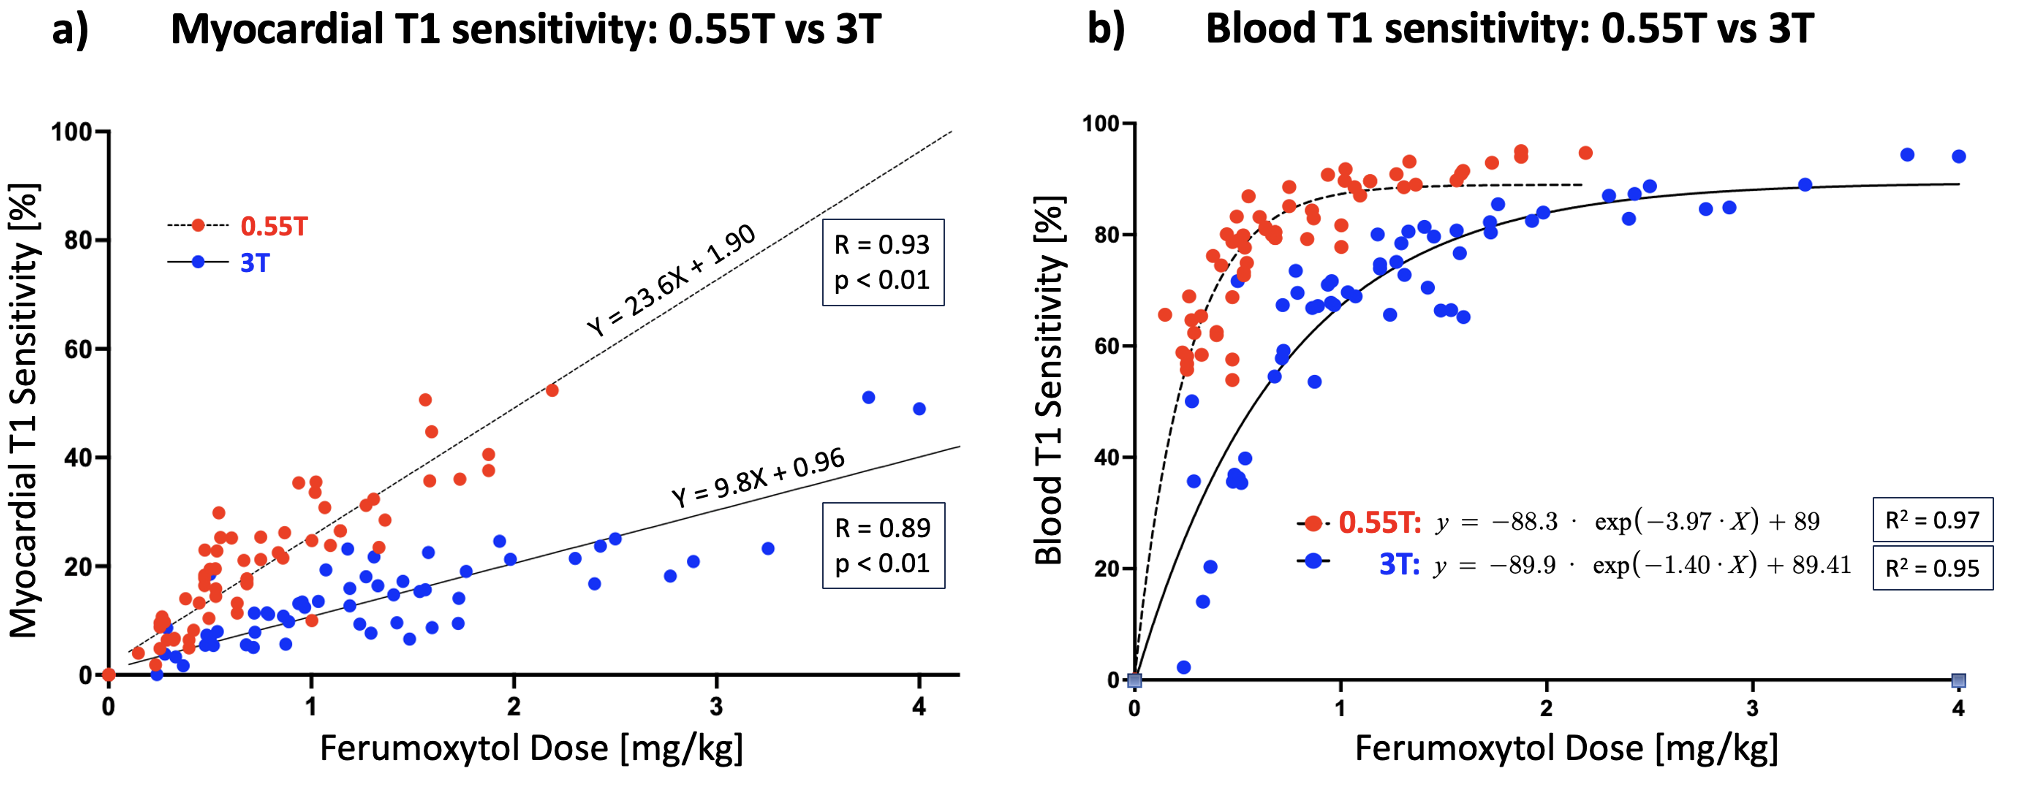 Figure 3: Evaluation of susceptibility and banding artifacts in MOLLI T1 maps at 0.55T versus 3T. (a) Artifact severity was scored by two blinded readers across 108 images using a 0–3 scale (0 = no artifacts, 3 = severe artifacts). The average scores were significantly lower at 0.55T (0.10 ± 0.35) compared to 3T (1.64 ± 1.11), indicating reduced artifact burden at the lower field strength (p < 0.01). (b) Sample T1-weighted bSSFP images (left) and corresponding MOLLI T1 maps (right) acquired at 3T (top) and 0.55T (bottom) illustrate this difference. Yellow arrows highlight susceptibility and banding artifacts visible at 3T but absent at 0.55T, underscoring the advantage of low-field imaging in minimizing artifact-related degradation.