Oral Abstracts Session

Marilena Giannoudi, PhD, MSc
Academic Clinical Lecturer in Cardiology
University of Leeds
Leeds, England, United Kingdom
Marilena Giannoudi, PhD, MSc
Academic Clinical Lecturer in Cardiology
University of Leeds
Leeds, England, United Kingdom
Marcella Conning-Rowland
Phd Candidate
University of Leeds, United Kingdom
Wasim Javed, MBChB, MRes
MRI Fellow
Leeds Institute of Cardiovascular and Metabolic Medicine, United Kingdom
Patrick Thompson
Cardiac Imaging Fellow
Leeds Institute of Cardiovascular and Metabolic Medicine
Leeds, England, United Kingdom
Oliver Brown
Cardiology Research Fellowgy
University of Leeds, United Kingdom
Michael Drozd
Academic Clinical Lecturer in Cardiology
University of Leeds, United Kingdom
Chew Cheng
Post Doc in cardiovascular research
University of Leeds, United Kingdom

Sven Plein, MD, PhD
Professor of Cardiology
Leeds Institute of Cardiovascular and Metabolic Medicine
Leeds, England, United Kingdom
Eylem Levelt
Academic Clinical Lecturer
Leeds Institute of Cardiovascular and Metabolic Medicine, University of Leeds
Leeds, England, United Kingdom

Peter P. Swoboda, PhD
Consultant Cardiologist
Leeds Institute of Cardiovascular and Metabolic Medicine
Leeds, England, United Kingdom
Richard Cubbon, PhD
Associate Professor
University of Leeds
Leeds, England, United Kingdom
Variable | Patients with HFrEF N=74 |
| |
Age, y | 66 (63, 68) | ||
Female, n (%) | 25 (34) | ||
BMI, kg/m2 | 29 (28, 30) | ||
Heart rate, bpm | 67 (63, 71) | ||
Systolic BP, mmHg | 119 (114, 124) | ||
Diastolic BP, mmHg | 76 (74, 79) | ||
Haemoglobin, g/L | 147 (143, 151) | ||
HbA1c, mmol/mol | 44 (41, 46) | ||
Cardiovascular Past Medical History |
| ||
Stroke TIA, n(%) | 5 (7) | ||
PAF, n(%) | 19 (26) | ||
Hyperlipidemia, n (%) | 30 (41) | ||
Hypertension, n (%) | 38 (51) | ||
CMR Results | |||
LV end-diastolic volume indexed to BSA, mL/m2 | 121 (108, 134) | ||
LV end-systolic volume indexed to BSA, ml/m2 | 79 (67, 92) | ||
LV mass, g | 145 (133, 156) | ||
LV mass indexed to BSA, g/m2 | 70 (64, 77) | ||
LV mass to LV end-diastolic volume, g/mL | 0.62 (0.59, 0.66) | ||
LV ejection fraction, % | 37 (34, 40) | ||
Native T1, (ms) | 1346 [1315, 1385] | ||
Extra cellular volume fraction, (%) | 32 (31, 33) | ||
Ischaemic LGE, n(%) | 22 (30) | ||
Non-Ischaemic LGE, n(%) | 26 (35) | ||
Visual Inducible ischaemia, n(%) | 9 (12) | ||
Stress MBF, ml/min/g | 1.5 (1.3, 1.5) | ||
Rest MBF, ml/min/g | 0.57 (0.52, 0.61) | ||
% change in RPP (stress - rest), % | 16 (10, 21) | ||
HFrEF indicates heart failure with reduced ejection fraction; y, years; BMI, body mass index; bpm, beats per minute; BP, blood pressure; HbA1c, glycemic hemoglobin; TIA, transient ischemic attack; PAF, paroxysmal atrial fibrillation; LV, left ventricle; BSA, body surface area; LGE, late gadolinium enhancement; MBF, myocardial blood flow; RPP, rate pressure product. Normally distributed continuous variables are expressed as mean (±95% confidence intervals); nonparametric continuous variables are expressed as median [IQR]; and categorical variables are expressed as counts (percent). P signifies p value for comparisons across the groups with t-test for normally distributed datasets and Mann-Whitney test for non-parametric tests.
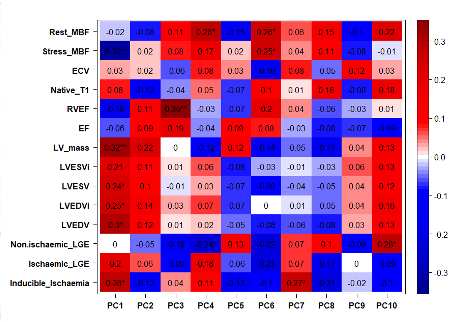
Figure 1: Eigencor plot showing principal components 1-10 correlated against selected CMR parameters. The scale denotes R values with asterisks representing p<0.05.