Congenital Track
Virtual Recording
Mehdi Hedjazi Moghari, PhD
Associate Professor
West Virginia University
-, West Virginia, United States
Sebastian Laudenschlager, PhD
Postdoctoral Fellow
West Virginia University
Mountain View, California, United States
Dhaval Chauhan, MD
Assistant Professor
West Virginia University
-, West Virginia, United States

Nita Ray Chaudhuri, MD
Associate professor of Pediatrics
West Virginia University
Morgantown, West Virginia, United States
Chrsitopher Mascio, MD
Professor
West Virginia University
-, West Virginia, United States
Jai Udassi, MD
Professor and Chief, Department of Pediatrics
West Virginia University
-, West Virginia, United States
Benjamin Frank, MD
Assistant Professor
University of Colorado and Children’s Hospital Colorado, Colorado, United States

Jennifer Romanowicz, MD
Assistant Professor
Children's Hospital Colorado
Denver, Colorado, United States

Yue-Hin Loke, MD
Associate Professor of Pediatrics
Children's National Hospital
Washington DC, District of Columbia, United States
Vitaly O. Kheyfets, PhD
Associate Professor
University of Colorado and Children’s Hospital Colorado, Colorado, United States
Center | N | QSVC (L/min) | QLPA (L/min) | QRPA (L/min) | PSVC (mmHg) | PLPA (mmHg) | PRPA (mmHg) | PLA (mmHg) | ΔPL (PLPA – P<sub>LA) | ΔPR (PRPA – P<sub>LA) |
1 | 16 | 1.07 ± 0.26 | 0.52 ± 0.20 | 0.56 ± 0.17 | 9.31 ± 1.49 | 8.88 ± 1.54 | 9.00 ± 1.55 | 4.44 ± 0.96 | 4.44 ± 1.26 | 4.56 ± 1.26 |
2 | 20 | 1.11 ± 0.33 | 0.47 ± 0.14 | 0.67 ± 0.25 | 12.30 ± 1.34 | 11.45 ± 1.28 | 11.85 ± 1.31 | 7.65 ± 1.53 | 3.80 ± 1.06 | 4.20 ± 1.11 |
3 | 6 | 1.00 ± 0.16 | 0.49 ± 0.14 | 0.51 ± 0.10 | 11.83 ± 2.14 | 10.83 ± 2.48 | 11.33 ± 2.42 | 7.83 ± 2.14 | 3.00 ± 1.67 | 3.50 ± 1.76 |
P-value | - | 0.854 | 0.820 | 0.100 | < 0.001 | < 0.001 | < 0.001 | < 0.001 | 0.066 | 0.333 |
 Figure 2: Confusion matrix of Fontan failure risk stratification agreement for a) Fick vs. CFD and b) Cath-CMR vs. CFD, using PHVD as an indicator. In this context, “Normal” refers to a transpulmonary pressure gradient ≤ 6 mmHg and an indexed PVR ≤ 3 iWU, while “Elevated” indicates values exceeding one of these two thresholds.
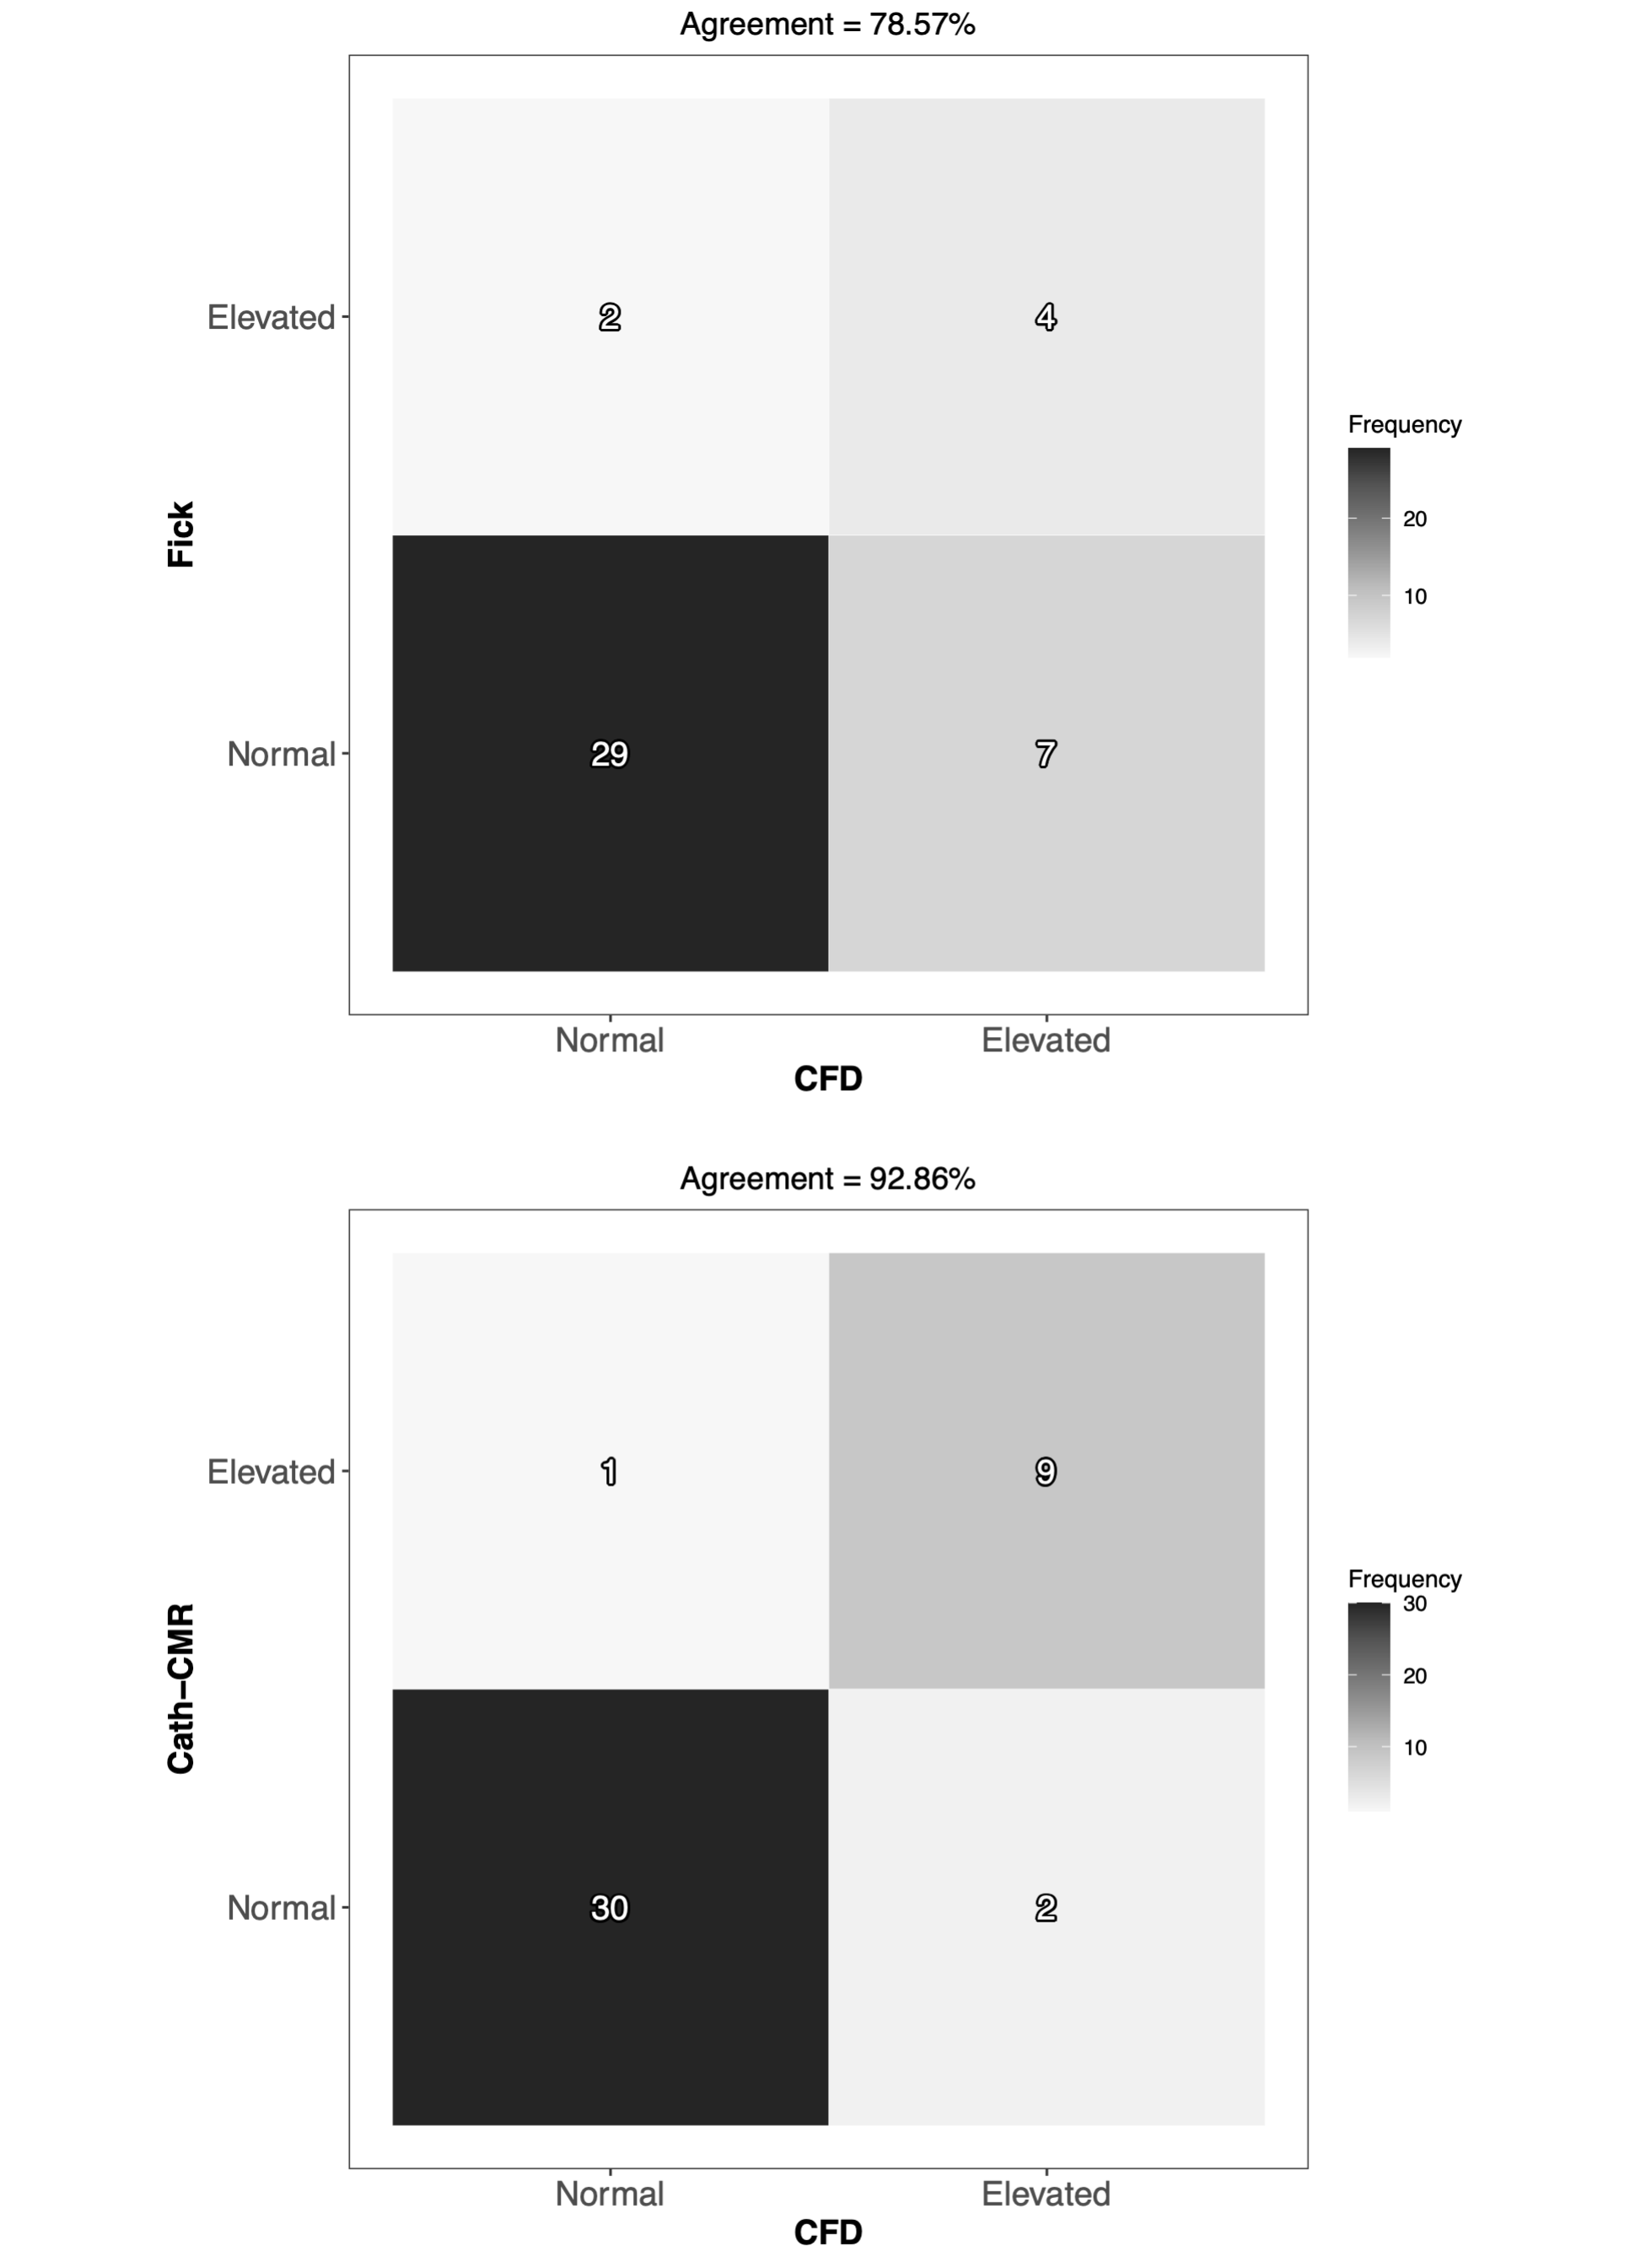 Figure 3: The individual lung resistances using the Cath-CMR method correlate well with those of the CFD method, particularly for the RPA. However, the Cath-CMR-based LPA PVR estimates show a bias of -0.78 iWU relative to the CFD-based LPA PVR, which is likely due to the increased proximal resistance in the LPA.
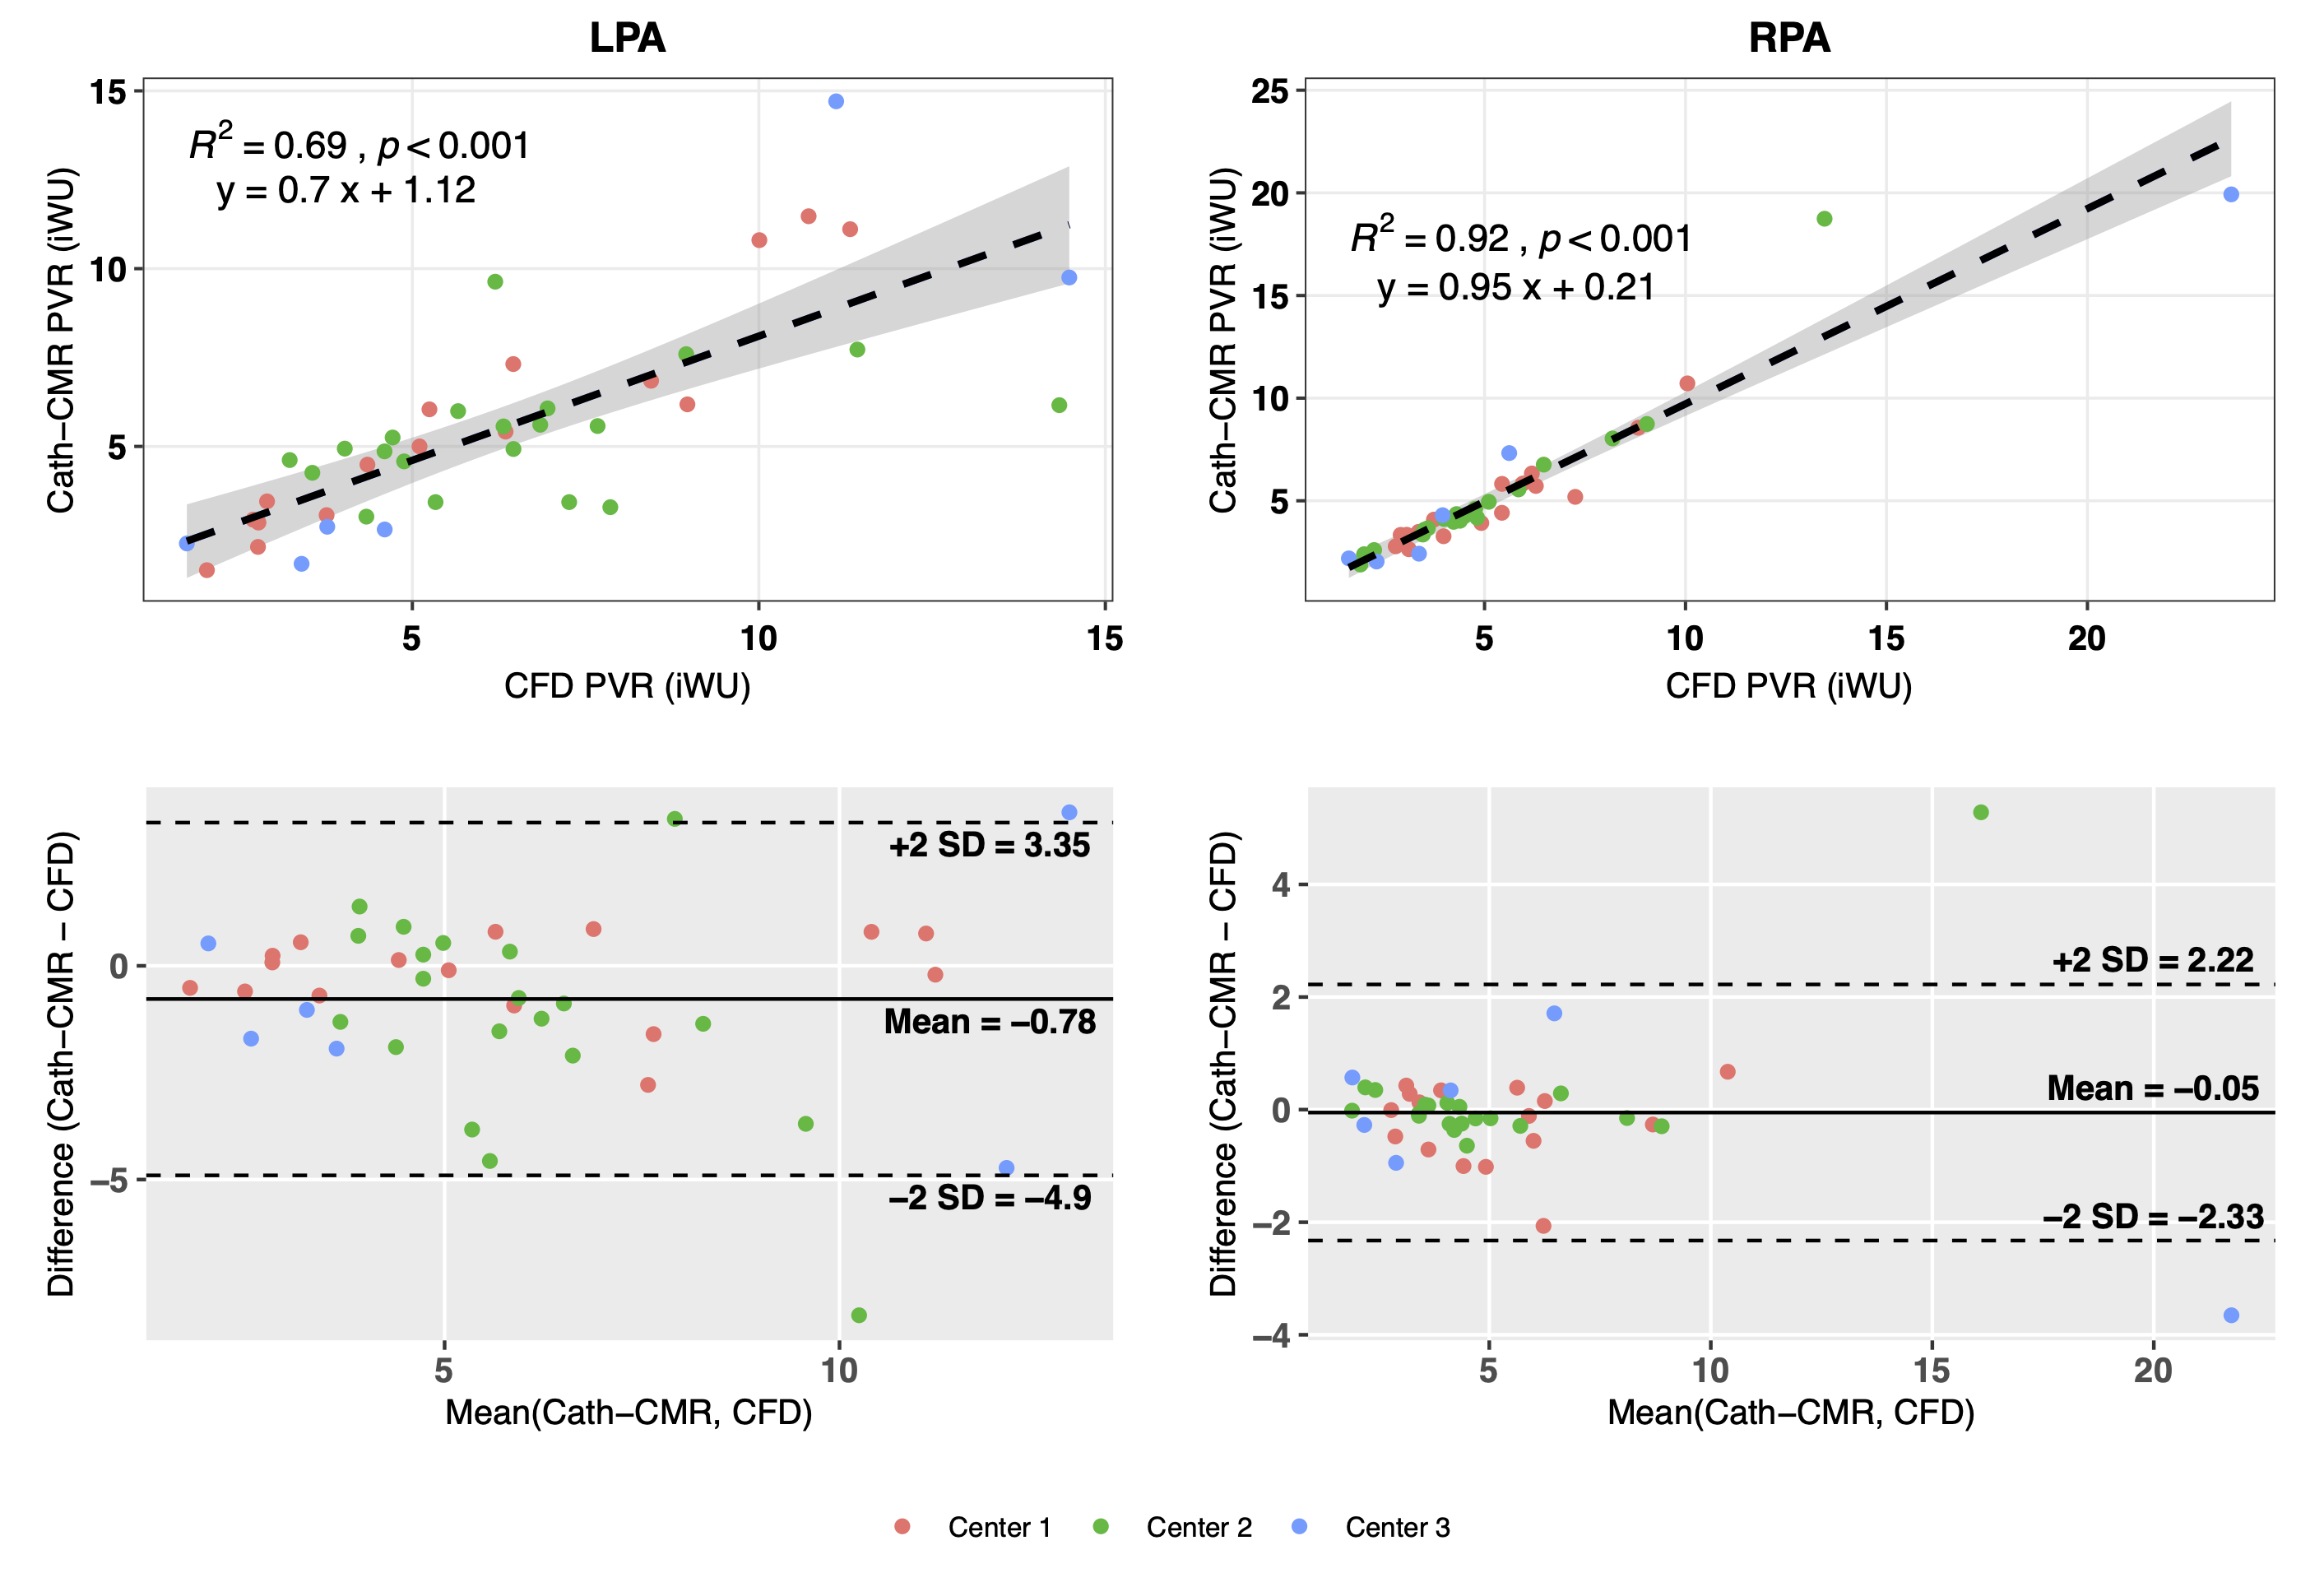