Rapid Fire Session
Thomas Anderton, MD
Clinical Research Fellow
University of Leeds
Leeds, England, United Kingdom
Thomas Anderton, MD
Clinical Research Fellow
University of Leeds
Leeds, England, United Kingdom

Bradley Chambers
Clinical Research Fellow
University of Leeds
Harewood, England, United Kingdom

Maryum Farooq, MB
Research Fellow
Leeds Institute of Cardiovascular and Metabolic Medicine, University of Leeds
Leeds, England, United Kingdom
Raluca Tomoaia, MD, PhD
Research Fellow
University of Leeds
Leeds, England, United Kingdom
Chin Yit Soo, MD
Clinical Research Fellow
University of Leeds
Leeds, England, United Kingdom
May Lwin, MD
Clinical Research Fellow
University of Leeds
Leeds, England, United Kingdom
Mehak Asad, MD, MPH
Clinical research fellow
University of Leeds, Multidisciplinary Cardiovascular Research Centre and Biomedical Imaging Science Department, Leeds Institute of Cardiovascular and Metabolic Medicine, LS2 9JT, United Kingdom
Leeds, England, United Kingdom
Michelle Gibbs
Medical Student
University of Leeds, England, United Kingdom
Stan Schofield, MB
Doctor
University of Leeds, United Kingdom
Erica Dall'Armellina, PhD
Associate Professor and Honorary Consultant Cardiologist
University of Leeds, England, United Kingdom

Sven Plein, MD, PhD
Professor of Cardiology
Leeds Institute of Cardiovascular and Metabolic Medicine
Leeds, England, United Kingdom
Shanmugakumar Chinnappa, PhD
Consultant Nephrologist
University of Leeds, United Kingdom

Peter P. Swoboda, PhD
Consultant Cardiologist
Leeds Institute of Cardiovascular and Metabolic Medicine
Leeds, England, United Kingdom
| All N= 106 | CKD 3b N= 20 | CKD 4 N= 51 | CKD 5 N= 35 | p-value 3b vs 5 |
4 vs 5 |
Demographics
|
|
|
|
|
|
|
Age (years) | 60 (±15) | 62 (±15) | 60 (±17) | 57 (±13) | 0.212 | 0.271 |
Male (n) | 78 (74%) | 10 (50%) | 42 (83%) | 26 (74%) | 0.071 | 0.369 |
BSA
| 1.97 (±0.25) | 1.91 (±0.21) | 1.98 (±0.24) | 1.99 (±0.27) | 0.246 | 0.9388 |
Laboratory results |
|
|
|
|
|
|
eGFR
| 20.5 (±9.5) | 36.5 (±3.7) | 20.3 (±4.6) | 11.7 (±2.7) | < 0.001 | < 0.001 |
Creatinine
| 308 (±129) | 149 (±28) | 276 (±57) | 442 (±106) | < 0.001 | < 0.001 |
Urea
| 21.3 (±22.3) | 12.0 (±2.4) | 22.3 (±31.1) | 25.4 (±8.7) | < 0.001 | < 0.001 |
Hct
| 0.38 (±0.05) | 0.41 (±0.04) | 0.39 (±0.05) | 0.36 (±0.06) | 0.002 | 0.003 |
NTProBNP
| 840 (±1121) | 278 (±414) | 686 (±852) | 1283 (±1464) | 0.015 | 0.020 |
Urine Alb/Cr ratio | 66.2 (±83.1) | 20.8 (±35.4) | 66.0 (±75.0) | 93.2 (±103.4) | 0.005 | 0.162 |
Medical History
|
|
|
|
|
|
|
HTN
| 76 (72%) | 13 (65%) | 37 (74%) | 26 (74%) | 0.470 | 0.860
|
DM
| 26 (22%) | 3 (15%) | 14 (28%) | 9 (26%) | 0.359 | 0.860 |
Type 2
| 23 (88%) | 3 (100%) | 13 (93%) | 7 (78%) | 0.540 | 0.691 |
Dyslipidemia
| 45 (44%) | 9 (50%) | 23 (46%) | 13 (37%) | 0.571 | 0.465 |
Current/past Smoker (n) | 48 (45%) | 8 (40%) | 27 (54%) | 13 (37%) | 0.899 | 0.158 |
Hemodynamics
|
|
|
|
|
|
|
HR (bpm) | 70 (±11) | 67 (±11) | 67 (±10) | 74 (±11) | 0.042 | 0.008 |
Systolic BP (mmHg) | 137 (±22) | 128 (±19) | 136 (±20) | 143 (±24) | 0.038 | 0.143 |
Diastolic BP (mmHg) | 78 (±9) | 75 (±6) | 80 (±9) | 77 (±11) | 0.408 | 0.288 |
CMR
|
|
|
|
|
|
|
LVEDV/BSA (ml/m2) | 82.7 (±18.4) | 74 (±13) | 81 (±18) | 90 (±19) | 0.001 | 0.021 |
LV SV/BSA (ml/m2) | 48.5 (±11.2) | 44.8 (±7.7) | 46.9 (±11.4) | 53.0 (±11.4) | 0.006 | 0.017 |
LVEF (%) | 59.7 (±7.0) | 61.1 (±4.3) | 59.0 (±7.8) | 60.1 (±7.0) | 0.570 | 0.524 |
Cardiac Output (L/min) | 5.72 (±2.79) | 3.79 (±2.80) | 5.63 (±2.24) | 6.73 (±3.15) | 0.001 | 0.061 |
LV Mass/BSA (Dias.) (g/m2) | 57.2 (±11.9) | 50.3 (±9.2) | 56.2 (±10.3) | 62.6 (±13.2) | < 0.001 | 0.010 |
LV Mass Volume Index. (g/ml) | 0.71 (±0.13) | 0.68 (±0.11) | 0.72 (±0.14) | 0.70 (±0.13) | 0.561 | 0.679 |
RVEDV/BSA (ml/m2) | 75 (±19) | 71 (±15) | 74 (±22) | 79 (±16) | 0.069 | 0.206 |
RV SV/BSA (ml/m2) | 44.1 (±12.0) | 42.0 (±7.6) | 41.3 (±13.6) | 49.3 (±9.8) | 0.006 | 0.004 |
RV EF (%) | 61.1 (±8.2) | 61.0 (±6.5) | 60.0 (±9.1) | 62.8 (±7.6) | 0.377 | 0.159 |
LA Vol/BSA (ml/m2) | 42.3 (±16.4) | 40.2 (±15.8) | 41.0 (±15.6) | 45.5 (±17.8) | 0.275 | 0.227 |
LA EF (%) | 55.8 (±15.1) | 55.2 (±14.0) | 53.9 (±15.3) | 58.8 (±15.4) | 0.405 | 0.154 |
PCWP (mmHg) | 14.6 (±2.7) | 13.4 (±1.6) | 14.4 (±2.4) | 15.4 (±3.3) | 0.026 | 0.124 |
Native T1 (ms) | 1321 (±41) | 1304 (±49) | 1320 (±40) | 1332 (±35) | 0.020 | 0.183 |
T2 (ms) | 44 (±3) | 43 (±2) | 44 (±3) | 44 (±3) | 0.254 | 0.433
|
GLS (%) | -15.5 (±3.19) | -16.6 (±1.9) | -15.2 (±3.7) | -15.3 (±2.9) | 0.112 | 0.911
|
Contrast CMR
|
N=98 |
N=18 |
N=48 |
N=32 |
|
|
ECV (%) | 26.3 (±3.2) | 25.1 (±3.4) | 26.3 (±3.3) | 27.2 (±2.9) | 0.029 | 0.213 |
rMBF (ml/g/min) | 0.83 (±0.23) | 0.73 (±0.18) | 0.79 (±0.19) | 0.94 (±0.24) | 0.003 | 0.003 |
rMBFcorr (ml/g/min) | 0.93 (±0.27) | 1.06 (±0.17) | 0.90 (±0.24) | 0.95 (±0.33) | 0.352 | 0.418 |
sMBF (ml/g/min) | 2.05 (±0.66) | 2.22 (±0.86) | 1.97 (±0.65) | 2.05 (±0.59) | 0.430 | 0.599 |
MPR
| 2.59 (±0.94) | 3.10 (±1.22) | 2.59 (±0.84) | 2.35 (±0.87) | 0.026 | 0.246 |
MPRcorr
| 2.22 (±0.95) | 2.28 (±1.14) | 2.22 (±0.88) | 2.20 (±1.03) | 0.853 | 0.929 |
Regional Ischaemia | 7 (7%) | 0 (0%) | 0 (0%) | 7 (22%) | 0.022 | < 0.001 |
Ischaemic LGE
| 7 (7%) | 0 (0%) | 2 (4%) | 5 (16%) | 0.072 | 0.083 |
Non-ischaemic LGE | 33 (34%) | 4 (22%) | 19 (40%) | 10 (31%) | 0.435 | 0.409 |
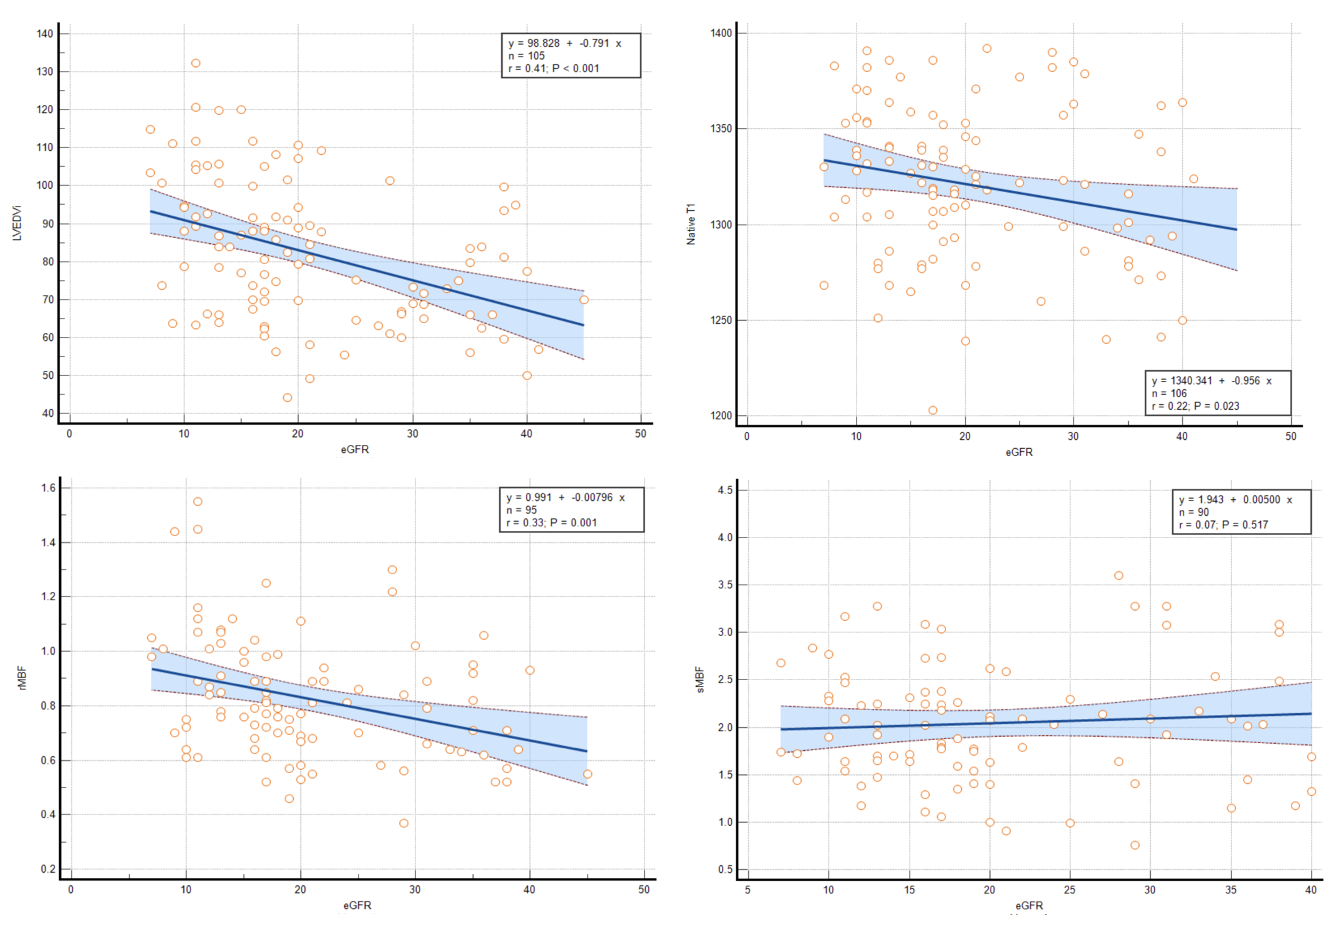
BSA: Body surface area, BP: Blood pressure, corr: Values corrected to rate pressure product, DM: Diabetes Mellitus, ECV: Extracellular volume, EDV: End diastolic volume, EF: Ejection fraction, eGFR: Estimated glomerular filtration rate, g: Grams, GLS: Global longitudinal strain, Hct: Haematocrit, HR: Heart rate, HTN: Hypertension, LA: Left atrium LGE: Late gadolinium enhancement, LV: Left ventricle, MBF: Myocardial blood flow, ml: Millilitres, MPR: Myocardial perfusion reserve, PCWP: Pulmonary capillary wedge pressure, RV: Right ventricle, SV: Stroke volumeFigure 1 – CMR Assessment of advanced CKD: ‘Uraemic cardiomyopathy'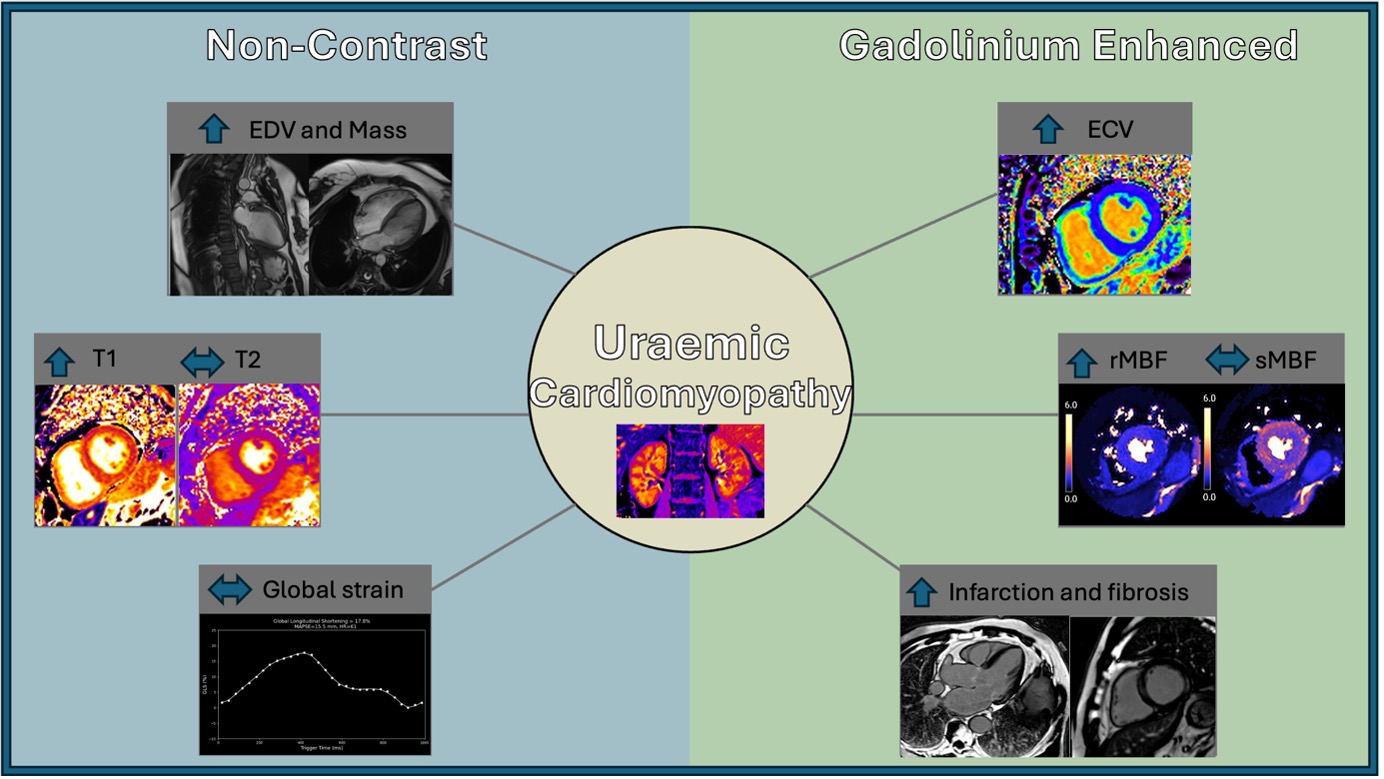 Figure 2 – Scatter plots and regression lines with confidence intervals of (clockwise from top left) LVEDV/BSA, Native T1, rMBF and sMBF against eGFR.